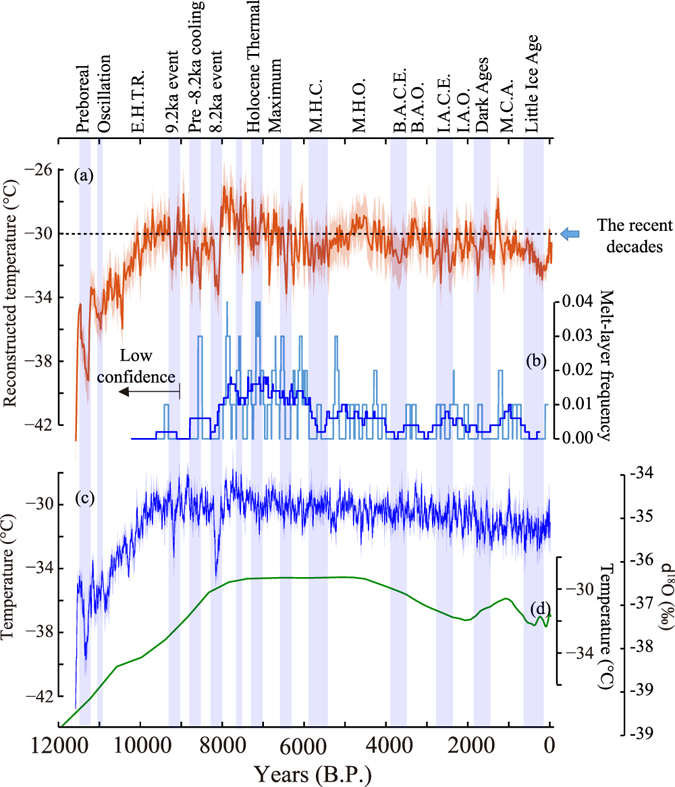
Figure 2.

Greenland Summit temperature and its proxies over the Holocene. (a) Reconstructed temperature from argon and nitrogen isotopes with 2σ error bands. (b) Melt-layer frequency (times per years) in 100 and 500-year RMs with light blue and blue lines, respectively. Note that the data before 9000 B.P. has low confidence20. (c) δ18Oice and a calibrated temperature scale in 20-year RMs with 2σ error bands from GISP214, GRIP, and NGRIP15 (Methods) (d) GRIP borehole temperature inversion42. Blue shades are Greenland cold episodes. E.H.T.R. = Early Holocene Temperature Rise, M.H.C. = Mid-Holocene Cooling, M.H.O. = Mid-Holocene Optimum, B.A.C.E. = Bronze Age Cold Epoch, B.A.O. = Bronze Age Optimum, I.A.C.E. = Iron Age Cold Epoch, I.A.O. = Iron Age Optimum, M.C.A. = Medieval Climate Anomaly. The names are given according to the Greenland temperature changes or common usages if available.
