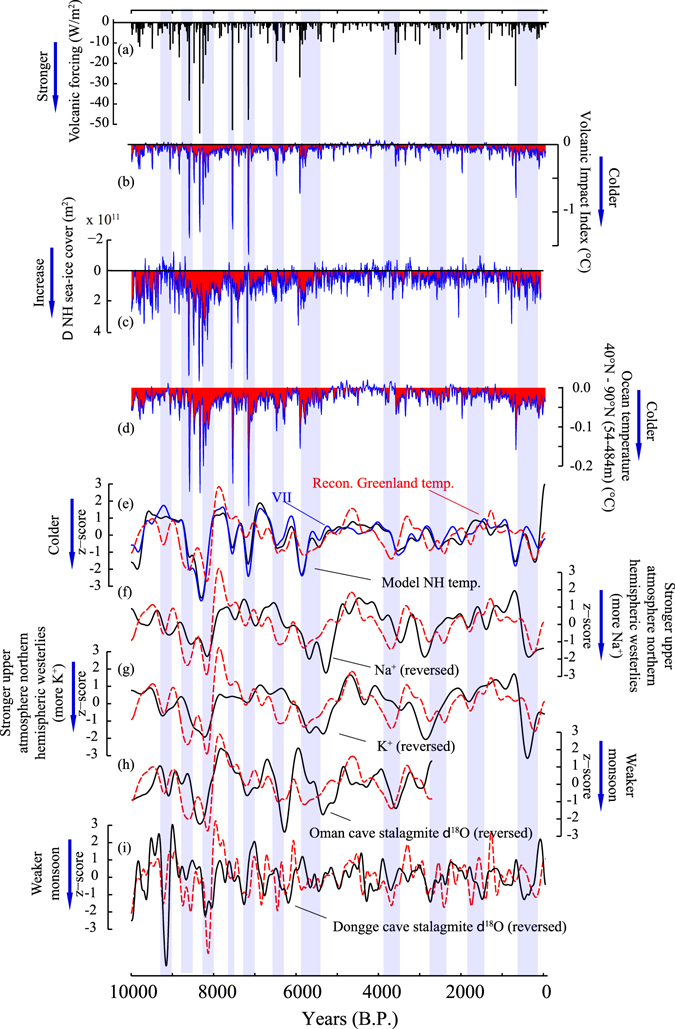
Figure 4.

Centennial to millennial-scale volcanic impacts on climate over the past 10,000 years. (a) Raw volcanic forcing, (b) Volcanic Impact Index (VII), the difference between two curves in Fig. 3c. (c) ΔNH sea-ice cover (y-axis is reversed) is calculated as differences between experiments with full forcing and without volcanic forcing (ensemble means) in 21-year RMs, (d) as in (c) but for ocean temperature (54–484 m) in 40°N–90°N. Red dotted lines in (e–i) show bandpass-filtered Greenland temperatures, which are compared to (e) modeled NH average temperatures (Methods), and VII, (f) Na+ ion in GISP2 (a proxy for atmospheric circulation)22, (g) K+ ion in GISP2 (proxy for atmospheric circulation)22, (h) Oman cave stalagmite δ18O1, (i) Dongge cave stalagmite δ18O64,65. Different bandpass filters were applied for (e,f,g,h) and (i) with 400–4000 year bands and 200–2000 year bands after linear detrending, respectively (Methods). Red areas in (b–d) indicate periods under relatively strong volcanic influence. Blue shades are the Greenland cold episodes as in Fig. 2.
