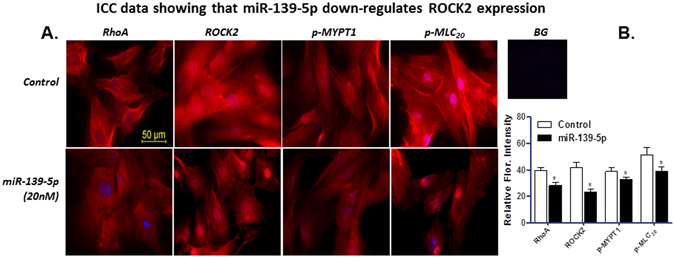
Figure 4.

Immunocytochemistry data before and after miRNA-139-5p. (A) Immunocytochemical images showing expression of RhoA, ROCK2, p-MYPT1, and p-MLC20 following transfection of IAS SMCs with miRNA-139-5p. (B) Quantitative data showing significant (*p < 0.05) downregulation of immunofluorescence intensity of RhoA, ROCK2, p-MYPT1, and p-MLC20 in the IAS SMCs following transfection with miRNA-139-5p as compared with controls (cells treated with scrambled miRNA). BG = background.
