
Figure 2.
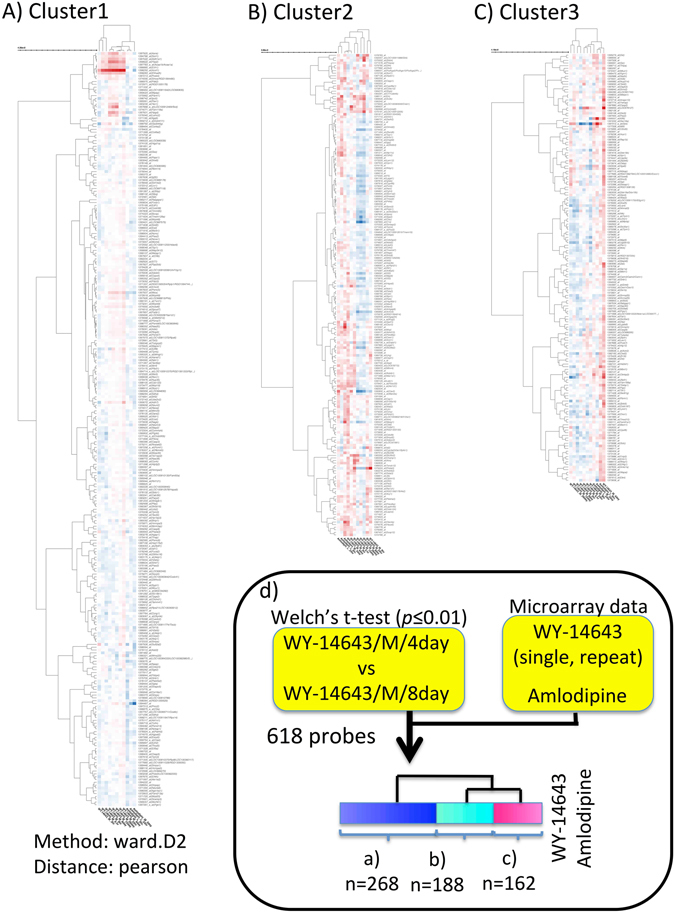
Heatmap of gene expression profiles obtained by treatment of WY-14643. The dendrogram was made without log-transformation of the axis, according to a hierarchical clustering result (method: ward.D2, distance: Pearson). (A) Gene expression profile of M4vs8_cluster1 (probe: n = 268). The x-axis represents experimental conditions (from left to right, (1–8) WY-14643 3 hr, 6 hr, 9 hr, 8 day, 15 day, 29 day, 24 hr and 4 day; (9–11) amlodipine 6 hr, 24 hr and 3 day. The y-axis represents probes in M4vs8_cluster1. (B) Gene expression profile of M4vs8_cluster2 (probe: n = 188). The x-axis represents experimental conditions (from left to right): (1–3) amlodipine 24 hr, 6 hr and 3 day; (4–11) WY-14643 4 day, 3 hr, 6 hr, 15 day, 29 day, 8 day, 24 hr and 9 hr. The y-axis represents probes in M4vs8_cluster2. (C) Gene expression profile of M4vs8_cluster3 (probe: n = 162). The x-axis represents experimental conditions (from left to right, 1–7) WY-14643 29 day, 15 day, 8 day, 3 hr, 6 hr, 24 hr and 9 hr; (8–10) amlodipine 24 hr, 3 day and 6 hr; 11) WY-14643 4 day). The y-axis represents probes in M4vs8_cluster3. (D) Analytical workflow for obtaining three M4vs8_clusters in (Fig. 2A–C). A gene set was selected by filtering DEGs between WY-14643/M dose/4 day and WY-14643/M dose/8 day by Welch’s t-test (cutoff: p-value = 0.01). As columns, Open TG-GATEs samples of WY-14643 (single dose (30 mg/kg bw): 3 hr, 6 hr, 9 hr, 24 hr, repeat dose (30 mg/kg bw): 4 day, 8 day, 15 day, 29 day) and external samples of amlodipine (uploaded to Toxygates by “user data upload function”, L dose (0.2 mg/kg), 6 hr or 24 hr, and M dose (19 mg/kg), 3 day) were used. The clusters were obtained by hierarchical clustering (dendrogram cutoff: 6). The high-resolution image file is available at Scientific Reports online.