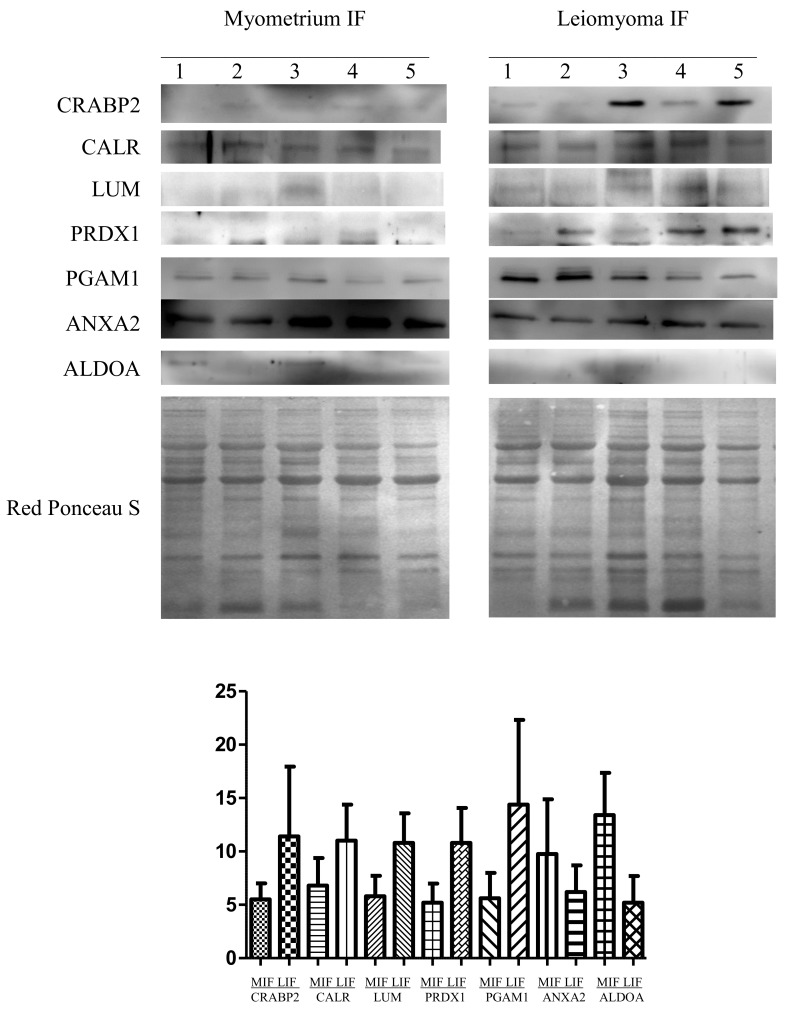
Figure 3.
Western blot analysis of CRABP2, CALR, LUM, PRDX1, PGAM1, ANXA2 and ALDOA in paired MIF and LIF. The intensity of the immunostained bands was normalized against the total protein intensities measured from the same blot stained with Red Ponceau S. The bar graph shows the relative expression (band density) of proteins in the MIF and LIF. The results are shown as a histogram (mean) with error bars representing the standard deviation. All differences were observed to be significant (Wilcoxon signed-rank test for matched samples, P<0.05). MIF, myometrium IF; LIF, leiomyoma IF; IF, interstitial fluid; CRABP2, cellular retinoic acid binding protein 2; CALR, calreticulin; LUM, lumican; PRDX, peroxiredoxin; PGAM1, phosphoglycerate mutase 1; ANXA2; annexin A2; ALDOA, aldolase A.

