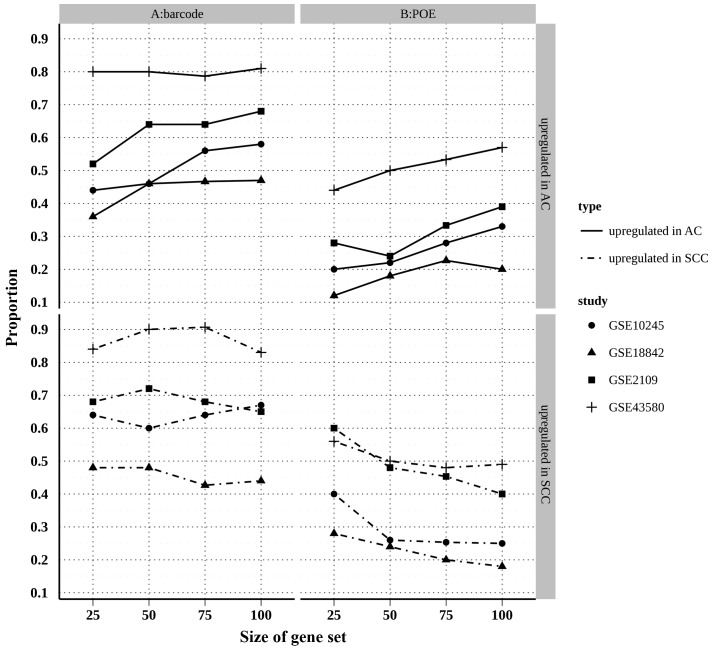
Figure 4.
Correspondence at the top plot for two methods. The proportions of overlapped genes in top 200 differentially expressed genes between meta-analysis and single-study analysis. (A) Barcode method; (B) POE method. AC, adenocarcinoma; SCC, squamous cell carcinoma; POE, probability of expression.

