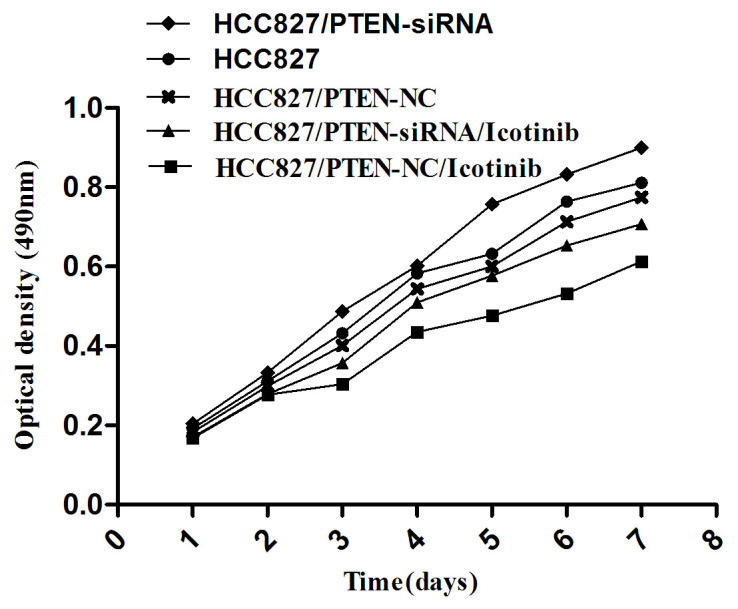
Figure 5.

The cell growth curve for each group. A cell growth curve presents the absorbance values with the ordinate and time as abscissas. Data are presented as the mean ± standard deviation from three independent experiments. PTEN, phosphatase and tensin homolog; NC, negative control; siRNA, small-interfering RNA.
