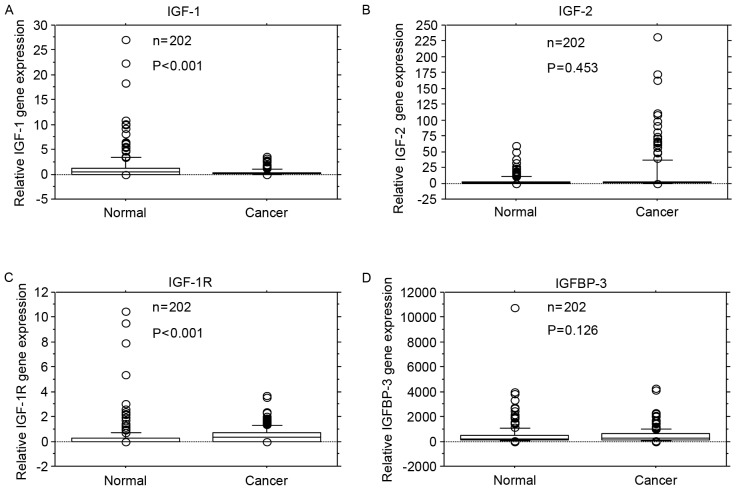
Figure 1.
Comparison of IGF-1, IGF-2, IGF-1R and IGFBP-3 mRNA expression levels in colorectal cancer tissue (Cancer) and adjacent normal mucosa (Normal). (A) IGF-1 gene expression levels were lower in cancer tissue compared with adjacent normal mucosa (P<0.001). (B) IGF-2 gene expression levels did not differ significantly between cancer tissue and adjacent normal mucosa (P=0.453). (C) IGF-1R gene expression levels were significantly higher in cancer tissue compared with adjacent normal mucosa (P<0.001). (D) IGFBP-3 gene expression levels did not differ significantly between cancer tissue and adjacent normal mucosa (P=0.126). Box boundaries demonstrate the 25th and 75th percentiles of the observed values. Capped bars indicate the 10th and 90th percentiles and the solid line presents the median average. The P-values were calculated with the Wilcoxon signed-rank test. IGF, insulin-like growth factors; IGF-1R, IGF-1 receptor; IGFBP, IGF binding protein.

