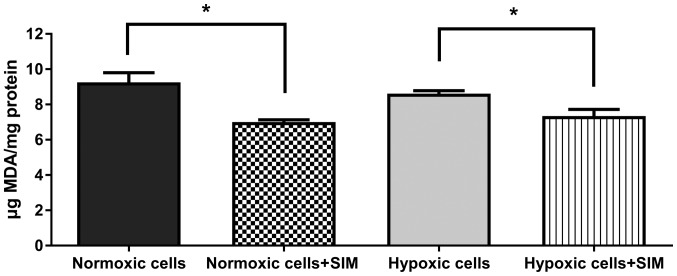
Figure 6.
Evaluation of SIM effects on oxidative stress in B16.F10 melanoma cells. MDA levels were determined by high-performance liquid chromatography analysis. The results are expressed as the mean ± standard deviation of two independent measurements. Unpaired Student's t test was performed to analyze the differences between MDA levels in SIM-treated and control cells. *P<0.05. Normoxic cells, MDA levels in untreated cells after 24 h of incubation with culture medium; Normoxic cells + SIM, MDA levels in normoxic cells after 24 h of incubation with 5 µg/ml SIM; Hypoxic cells, MDA levels in cells after 24 h of incubation with medium supplemented with 200 µM CoCl2; Hypoxic cells + SIM, MDA levels in cells after 24 h of incubation with medium supplemented with 200 µM CoCl2 and treated with 5 µg/ml SIM; SIM, simvastatin; MDA, malondialdehyde.

