Figure 3.
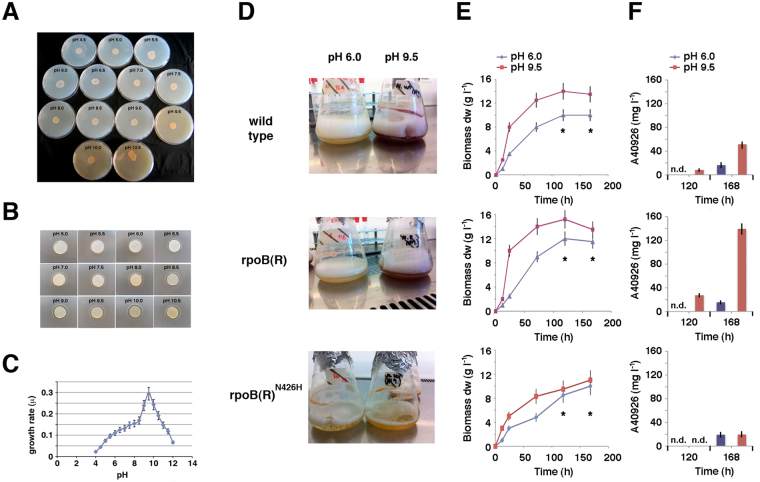
Growth, phenotype and antibiotic production at different pH. (A,B) Pictures showing growth (A) antibiotic production (B) of N. gerenzanensis grown on YS agar at different initial pH values. Antibiotic production was evaluated by microbiological assay using S. aureus as a tester microorganism. (C) Specific growth rates (μ = number of replication per h) during the logarithmic phase of N. gerenzanensis growing in YS broth at different pH values. Data are shown as mean ± standard deviation from at least three independent experiments. (D–F) Red pigment and A40926 antibiotic production in response to pH by N. gerenzanensis and derivative rpoB(R) and rpoB(R)N462H strains. In panel D flasks containing N. gerenzanensis and derivative strains after growth in liquid YS broth at pH 6.0 and 9.5 for 168 h are shown. Biomass and A40926 production by N. gerenzanensis and derivative strains growing in YS broth at pH 6.0 and 9.5 are shown, respectively, in panels E and F. A40926 production was evaluated by HPLC. Data are shown as mean ± standard deviation from at least three independent experiments.

