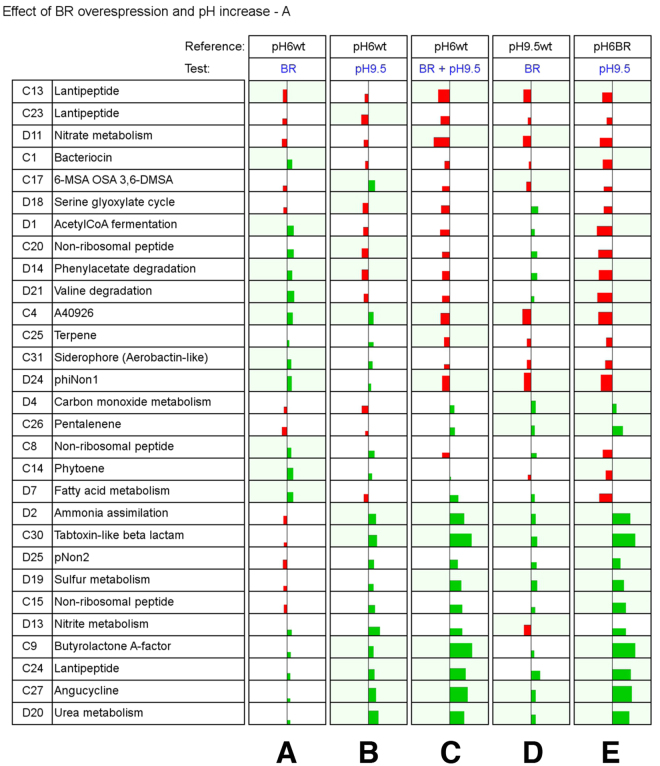
Figure 5.
Overview of GSEA results. Effects of rpoB(R) over-expression and pH increase are reported by contrasting the rpoB(R) strain to wild type strain data. Gene-sets with Normalized Enrichment Score (NES) >1.70 and False Discovery Rate (FDR) <0.1 in at least one of the contrasts are reported. Green and red colors indicate, respectively, up-regulation and down-regulation in test strain vs. reference strain. If a set passed these thresholds in a contrast, the background of the cell is colored in pale green. For each set in each contrast, the width of the rectangle represents the mean log2FC of the leading edge subset, while the height represents the NES. Gene-sets are labeled with an ID indicating whether they consist in clustered (ID number preceded by the letter C) or dispersed (ID number preceded by the letter D) genes. Abbreviations: wt, wild type strain; BR, rpoB(R) strain.

