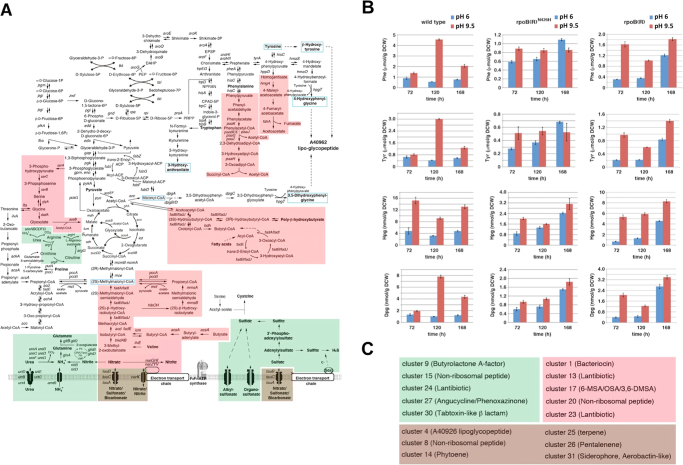
Figure 6.
Metabolic pathways, gene clusters for secondary metabolites, and quantitative determination of intracellular levels of A40926 lipoglycopeptide biosynthetic precursors. (A) Metabolic pathways affected by environmental pH and rpoB(R) based on GSEA data. Green shading marks metabolic pathways whose gene-sets are synergistically up-regulated by alkaline pH and exogenous rpoB(R) addition. Red shading marks metabolic pathways whose gene-sets exhibit a trend of down-regulation in response to alkaline pH and exogenous rpoB(R) or rpoB(R) N426H addition. Brown shading identifies metabolic pathways whose gene-sets exhibit a more complex pattern depending on the different behavior of paralogs. (B) Quantitative assessment of intracellular levels of phenylalanine (Phe), tyrosine (Tyr), 3,5-dihydroxyphenylglycine (Dpg) and 4-hydroxyphenylglycine (Hpg) in wild type and derivative strains at different time points. (C) Gene clusters for secondary metabolites affected by environmental pH and rpoB(R) based on GSEA data. Green and red shadings are as in A. Brown shading identifies gene clusters with a more complex expression pattern.

