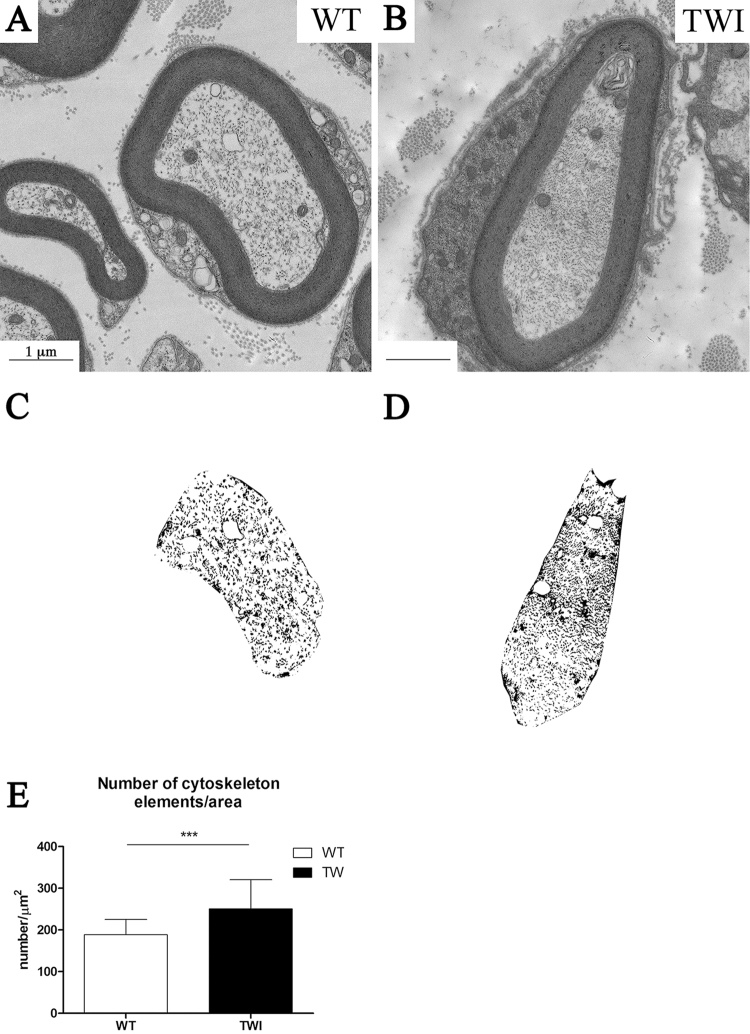
Figure 2.
Axonal cytoskeleton density is increased in P30 TWI mice sciatic nerves. (A,B) bright field images of representative axons in WT (A) and TWI (B) sciatic nerves. (C,D) bitmaps obtained with the semi-automated method to compute axonal cytoskeleton density from the images in A and B, respectively. (E) Quantification of cytoskeleton elements density.

