
Figure 3.
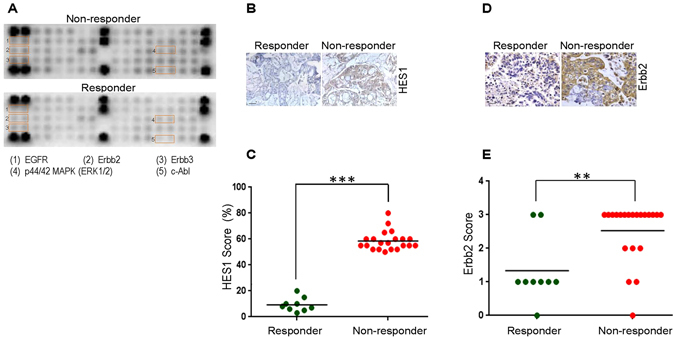
Validation of potential targets identified by transcriptomic analysis in the cohort non-responsive to cetuximab. (A) RPPA profiling for multiple targets was performed using total proteins extracted from cetuximab-sensitive (bottom) and cetuximab-resistant (top) tumors at baseline. Spots are in duplicate and each pair corresponds to a specific RTK or signaling node as defined in the array map. The orange insert represents EGFR and associated pathways deregulated in non-responders relative to responders. (B) To evaluate the baseline expression of pathway specific markers in responder (left column) and non-responder (right column) tumor samples from mCRC, the formalin fixed and paraffin embedded sections were probed with antibody against HES1. Representative images were taken at 200X magnification. (C) Scatter plot depicting HES1 levels in the responder (n = 9) and non-responder (n = 21) population. HES1 scoring was performed using IHC on a scale of 0 to 100% in each of the tumor sections and significance (***P < 0.001, n = 27) was calculated using student’s unpaired t-test. (D) To evaluate the baseline expression of Erbb2 in responder (left column) and non-responder (right column) tumor samples from mCRC, formalin fixed and paraffin embedded sections were probed with primary and secondary antibody as indicated. Representative images were taken at 200X magnification. (E) Scatter plot depicting Erbb2 levels in the responder (n = 9) and non-responder (n = 21) population. Erbb2 scoring was performed on a scale of 0 to 3+ using IHC and significance (**P < 0.01, n = 27) was calculated using student’s paired t-test.