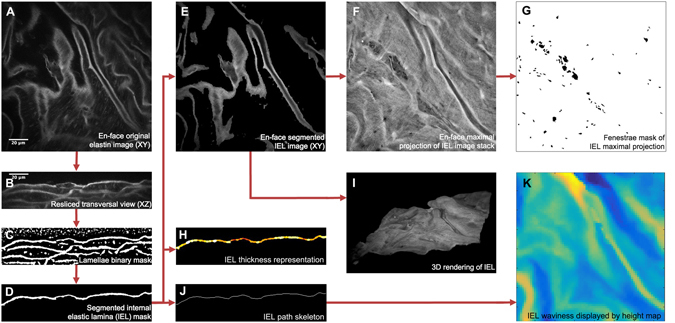
Figure 2.

Image processing protocol to obtain en-face segmented elastic laminae and subsequent quantitative analysis. (A) Representative image of an acquired original en-face TPEF stack. Elastin TPEF and background cell autofluorescence signals are visualized in grey scale. (B) Representative image of the resliced original stack to transverse view. (C) Representative image of the binary mask stack that was subsequently obtained. Elastin signal and some background spots are automatically marked in white, the rest of the tissue is marked in black. (D) Representative image of segmented individual lamina mask stack. In this case, only the IEL mask was selected. (E) Representative image of the resulting en-face IEL stack. (F) En-face maximal projection comprised of all images within the IEL stack. (G) Binary mask of all fenestrae seen at the maximal projection (F). (H) Representative image of thickness display stack. Highest thickness is marked by white colour. (I) 3D rendering of the lamella obtained from the IEL stack. (J) Representative image of lamella skeleton image stack. (K) Height map showing global lamella waviness. Yellow denotes low and dark blue high heights. Scale bar, 20 µm.
