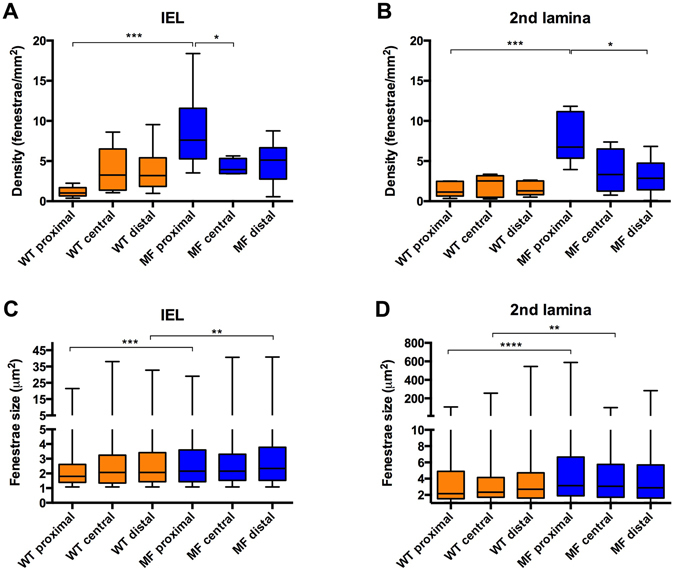
Figure 6.

Quantitative analysis of fenestrae in IEL and 2nd laminae in the longitudinal plane of the ascending aorta. The density of fenestrae in the IEL (A) and 2nd lamina (B), and their respective individual fenestrae size (C and D) measured at different longitudinal plane locations (proximal, central and distal) of WT (orange) and Marfan (MF, blue) ascending aortae. Statistical significance between groups is indicated by asterisks. Interquartile boxplots with minimum and maximum whiskers. Forty maximal projections were analysed and a total of 6,400 fenestrae were quantified.
