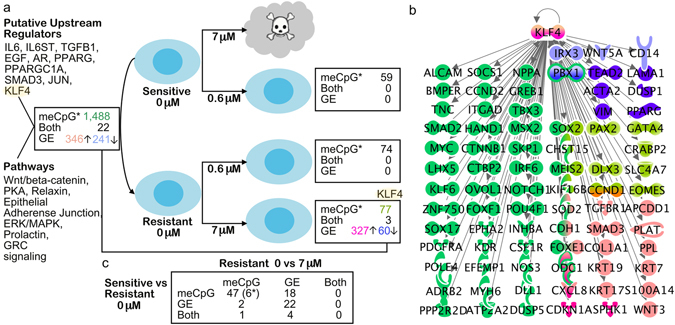
Figure 2.

Integrative analysis of DNA methylome, transcriptome and functional enrichment data. (a) In the figure are the numbers of differentially expressed genes (GE), differentially methylated CpG sites (meCpG) and their overlap (both) between cisplatin sensitive and resistant cells (M019i) before cisplatin treatment (0 μM), and changes detected in response to drug treatment. The putative upstream regulators with gene expression changes and canonical pathway enrichments common for both DNA methylome and transcriptome data are shown in the (b) Gene expression changes, DNA methylation changes or both are shown for the known direct target genes of KLF4, in different comparisons as indicated by the color codes in (a). (c) Comparison of differences observed before cisplatin treatment and in response to 7 μM cisplatin treatment of resistant cells as indicated in the figure. *indicates the number of differentially methylated sites: in integrative comparisons, the number of overlapping genes closest to differentially methylated sites is shown. The functional analyses and networks in the figure were generated by using Ingenuity Pathway Analysis (IPA®, Qiagen).
