Figure 4.

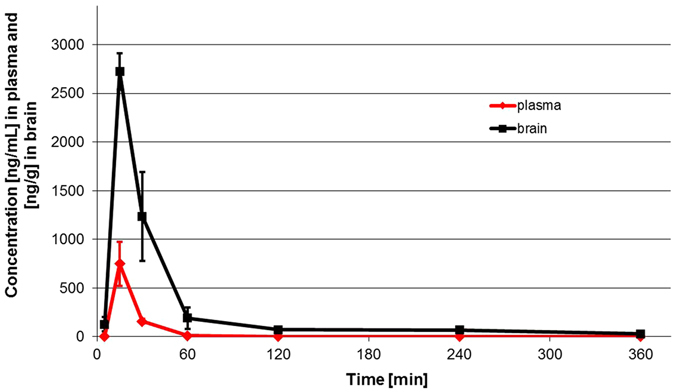
Concentration – time profiles for 1o in plasma and brain after intraperitoneal administration to mice at a dose of 5 mg/kg (linear plots). Concentrations of 1o in plasma and brain are expressed as ng/mL and ng/g, respectively.

Concentration – time profiles for 1o in plasma and brain after intraperitoneal administration to mice at a dose of 5 mg/kg (linear plots). Concentrations of 1o in plasma and brain are expressed as ng/mL and ng/g, respectively.