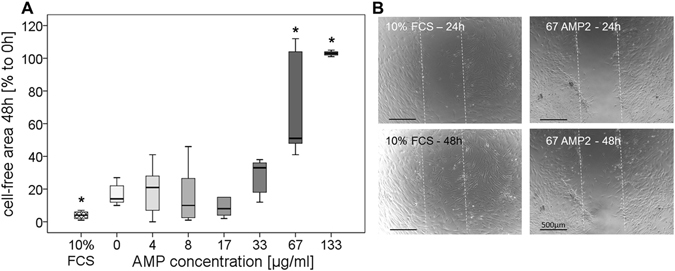
Figure 4.

Scratch assay with human primary osteoblast-like cells and different AMP2 concentrations (0–133 µg/ml). Measurement of the gap was directly done after performing the scratch and after 24 and 48 hours incubation (n = 3–9, cells from one donor). (A) The cell-free area after 48 hours is shown in percentage of the gap compared to time point 0 hours ( = 100%). Positive control: CM with 10% FCS. Data are shown as median with 25 and 75 percentiles. Kruskal-Wallis, Mann-Whitney, Bonferroni-Holm post-hoc test: *Significant difference compared to group treated with 0 µg/ml AMP, p ≤ 0.05. (B) Exemplary pictures of positive control and 67 µg/ml AMP2 after 24 and 48 hours. The dotted lines mark the scratch. Scale bar 500 µm.
