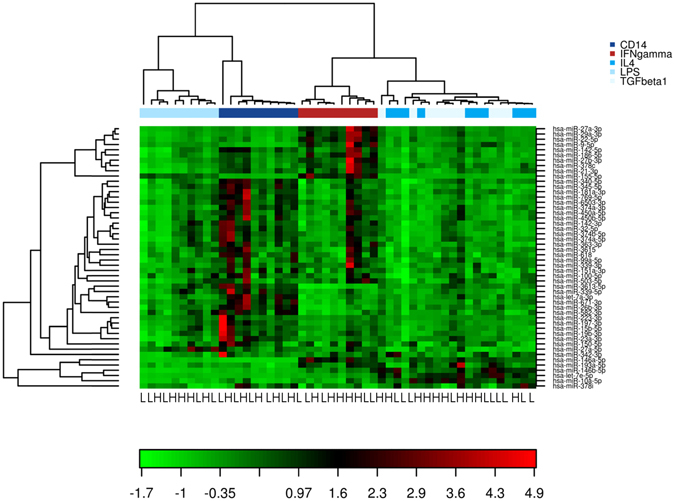
Figure 1.

Differential microRNA expression in patients with high and low collateral capacity. Heat map and un-supervised hierarchical clustering of the top 50 microRNAs with the highest coefficient of variation (based on log2-transformed tag per million normalized data) in monocytes/macrophages of patients with high (n = 5) or low (n = 5) capacity of the collateral circulation. Each row represents one microRNA and each column represents one sample. The color scale shows the relative expression level of microRNA across samples, where red color depicts an expression level above mean and green color represents down regulated expression. H: high collateral capacity; L: Low collateral capacity.
