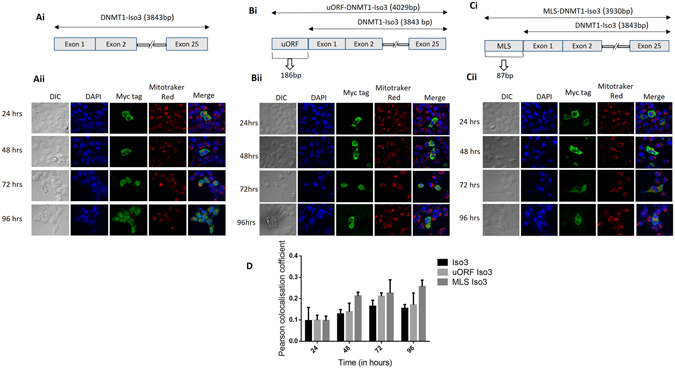
Figure 3.

Subcellular localization of DNMT1-isoform3 varies with advancing time period of expression. (Ai-Ci) Schematic diagram depicting the structure of: (Ai) DNMT1-iso3; (Bi) DNMT1-iso3 with uORF; (Ci) DNMT1-iso3 with MLS. (Aii-Cii) Representative confocal images of H1299 cells showing localization pattern of exogenously overexpressed: (Aii) DNMT1-iso3; (Bii) DNMT1-iso3 with uORF; (Cii) DNMT1-iso3 with MLS at four different time points (24, 48, 72, 96 hrs). (C) Pearson co-localization coefficient for mitochondrial localization of DNMT1-iso3, DNMT1-iso3 with uORF and DNMT1-iso3 with MLS.
