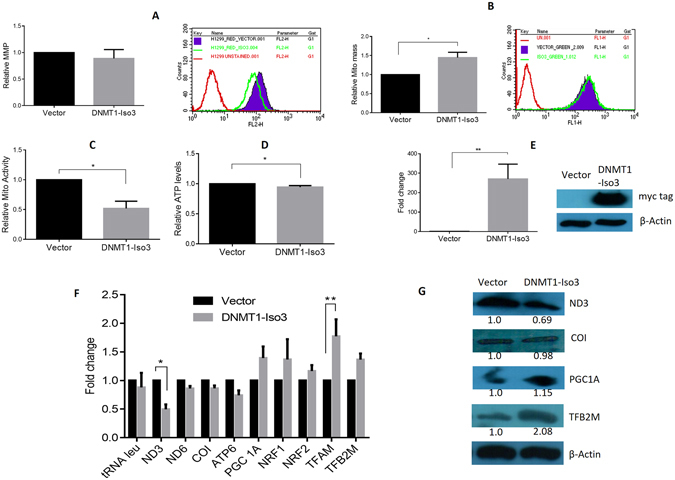
Figure 5.

Exogenous overexpression of DNMT1-isoform3 affects mitochondrial biology. Representative screen shots and bar diagram for relative: (A) mitochondrial membrane potential; (B) mitochondrial mass; (C) mitochondrial activity; (D) ATP levels on exogenous overexpression of DNMT1-isoform3 in H1299 cells. (E) The real time and Western profile of DNMT1-iso3 overexpressing cells. (F) Semi-quantitative gene expression profile and (G) Western blot scans of selected mtDNA encoded and nuclear genome encoded mt genes in overexpressing DNMT1-iso3 H1299 cells. Relative fold of expression of the analyzed protein was calculated by densitometry analysis on normalization with respective β-actin expression and indicated (in values) just below the scans. The western blot scans were cropped for presentation in the main figure, the original scans are provided in the supplementary information.
