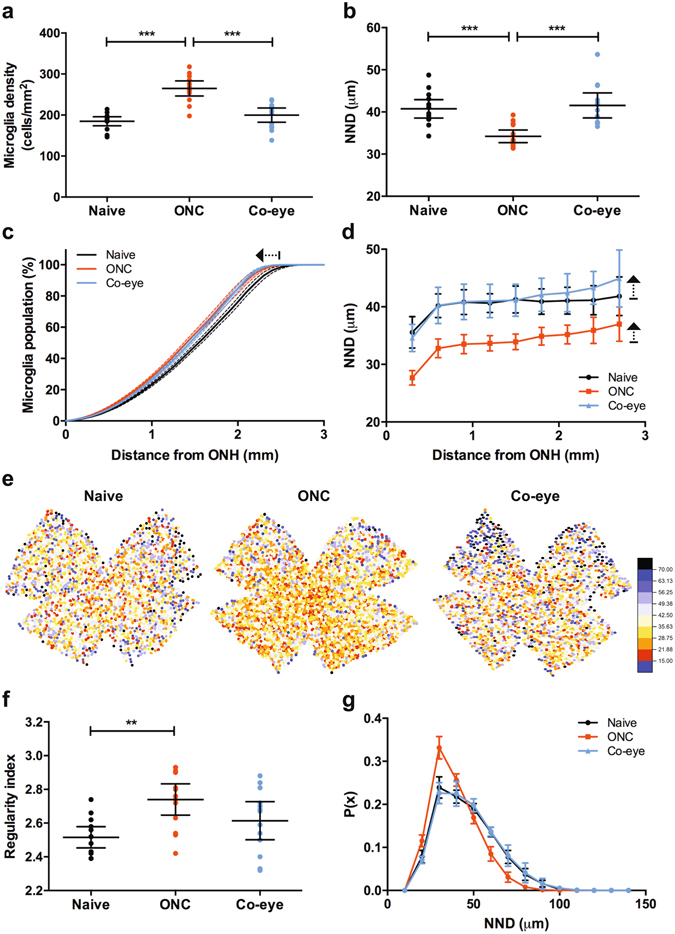
Figure 2.

Microglia numbers and distribution. (a) A significant increase in overall microglia density is seen when comparing naive versus ONC retinas (4 days post injury). The microglia density of microglia is not significantly different between naive retinas and retinas from the contralateral eye of the ONC animals (one-way ANOVA with Tukey’s post hoc test). (b) Nearest neighbour distance (NDD) is significantly higher in ONC retinas, but not in the contralateral eye (one-way ANOVA with Tukey’s post hoc test). (c) Plotting cumulative microglia density, depicted as a percentage of the total microglia number, reveals that retinal microglia density is higher in the central regions of retina in ONC and contralateral eyes versus naive eyes. This can be observed as a left-shift of the ONC and Co-eye curves (arrow). (d) Distribution analysis of NND, in relation to the distance from the ONH, indicates that overall NND decreases in ONC eyes in comparison to naive eyes. However, NND disproportionally increases in the peripheral retina, a pattern that can also be discerned in the retinas of contralateral eyes (arrows). (e) Pseudocolor images of microglia NND/density in retinal whole-mounts. Red-to-blue pseudocolour representation of microglia distribution, ranging from small NND (15 μm, red tones) to large NND (70 μm, blue tones). (f) The regularity index of the microglia population increases upon ONC (one-way ANOVA with Tukey’s post hoc test). (g) A probability function of the NND points out that both the mean NND and NND standard deviation decrease after ONC, which explains the increase in regularity index. Data are depicted as mean ± 95% confidence intervals.
