
Figure 7.
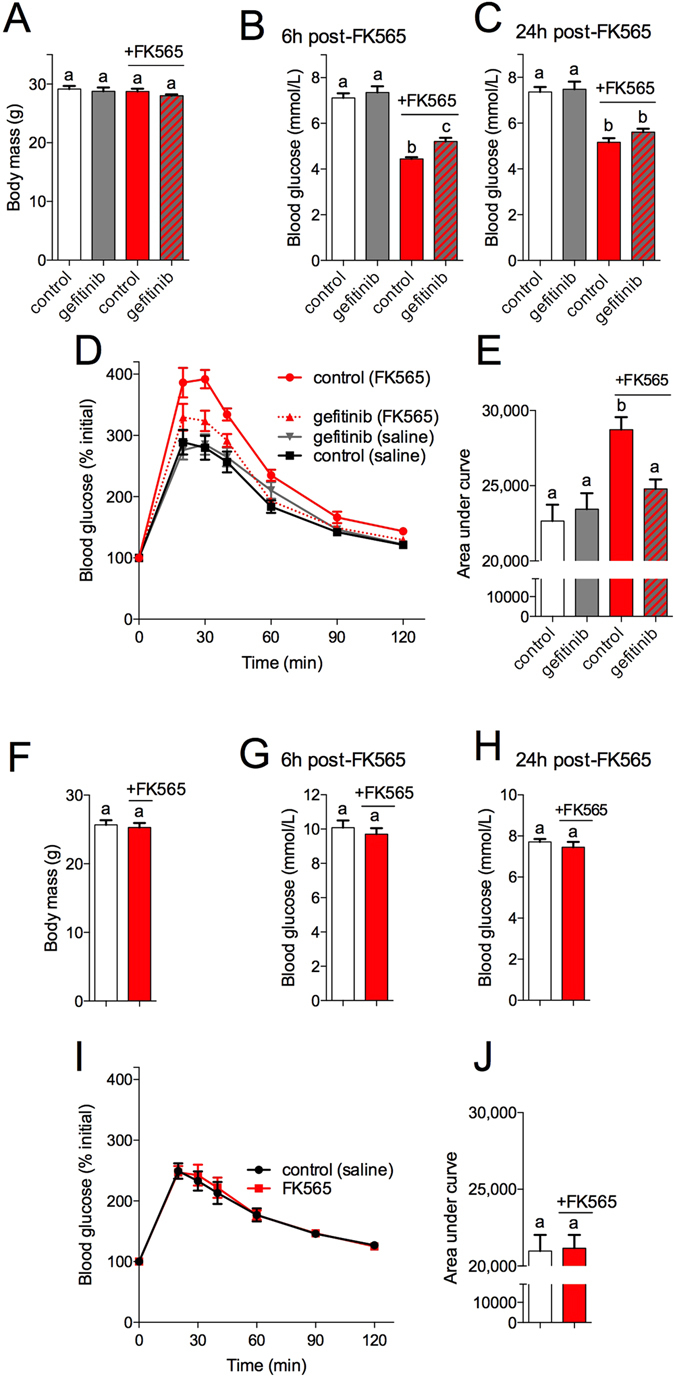
TKI gefitinib inhibits RIPK2-mediated dysglycemia in vivo. WT mice pre-treated with TKI gefitinib (100 mg/kg) or methylcellulose vehicle for 4 days before injection of a NOD1 ligand and metabolic testing. Body Mass (A) and fasting blood glucose at 6 h (B) and 24 h (C) after injection of WT mice with FK565 (10 μg, i.p.) in gefitinib and vehicle pretreated mice, n = 9–12. Percentage change in blood glucose over time (D) and area under the curve (E) of a glucose tolerance test (2.0 g/kg glucose, i.p.) 24 h after injection of WT mice with FK565 (10 μg, i.p.) in gefitinib and vehicle pretreated mice, n = 12. Body Mass (F) and fasting blood glucose at 6 h (G) and 24 h (H) after injection of RIPK2−/− mice with FK565 (10 μg, i.p.), n = 6–9. Percentage change in blood glucose over time (I) and area under the curve (J) of a glucose tolerance test (2.0 g/kg glucose, i.p.) 24 h after injection of RIPK2−/− mice with FK565 (10 μg, i.p.), n = 9. Values are mean ± SEM. Different letters assigned to each condition (a, b, c) denote statistical differences between groups (p < 0.05).