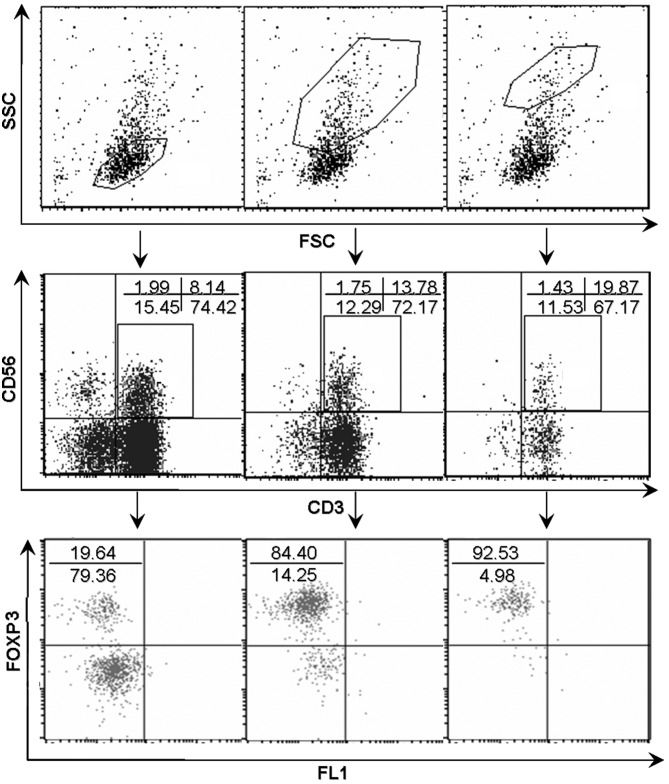
Figure 3.
FOXP3 expression in natural T cells in tumor infiltrating lymphocytes subsequent to gating on different FSC/SSC subsets. A dot plot analysis revealed a positive trend between the level of FOXP3 expression and FSC/SSC gating. The numbers in the dot plots indicated the percentages of corresponding subsets. FOXP3, forkhead box P3; FSC, forward scatter; SSC, side scatter; CD, cluster of differentiation; FL1, green fluorescence.

