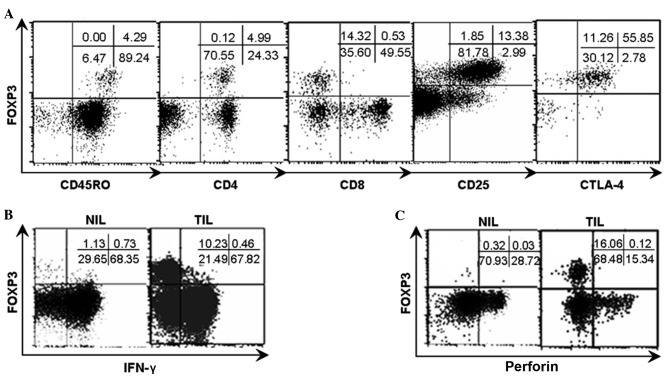
Figure 5.
Phenotypic characteristics of FOXP3+ natural T cells and the FOXP3/IFN-γ and FOXP3/perforin patterns in TILs and NILs from representative patients. Analyses were repeated with samples from 8–10 HCC patients with similar results. (A) The phenotypic analysis indicated that the FOXP3+ natural T cells were restricted to CD45RO+, CD4+, CD25+, CTLA-4+ and CD8− populations. (B) TILs and NILs were stimulated with PMA and ionomycine for 4 h respectively and subsequently analyzed for FOXP3/IFN-γ pattern subsequent to gating on natural T cells by flow cytometry. (C) TILs and NILs were analyzed for FOXP3/perforin pattern subsequent to gating on natural T cells by flow cytometry. The numbers indicate the percentage of corresponding subsets. FOXP3, forkhead box P3; IFN-γ, interferon-γ; TILs, tumor infiltrating lymphocytes; NILs, non-tumor infiltrating lymphocytes; HCC, hepatocellular carcinoma; CD, cluster of differentiation; CTLA-4+, cytotoxic T-lymphocyte-associated protein 4; PMA, phorbol-12-myristate-13-acetate.

