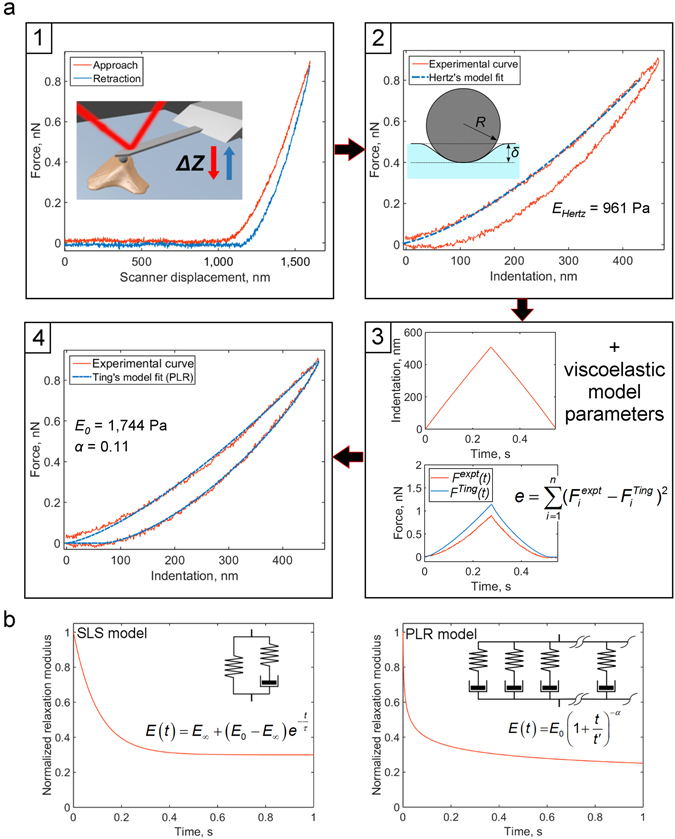
Figure 1.

Flowchart of the method and used viscoelastic models. (a) The flowchart. At the first step, a force-displacement curve obtained with a standard indentation protocol is pre-processed to determine zero force level and corrected for hydrodynamic drag (if needed). At the second step, the contact point is located and F-Z curve is transformed to the force-indentation coordinates. Apparent Young’s modulus E Hertz is calculated with the Hertz’s model. Inset: scheme of a spherical probe indenting a half-space. At the third step, the indentation time history is used to model the force curve with the Ting’s model and prescribed viscoelastic model. The difference between the modelled and experimental force curves (e) is minimized with the fitting algorithm. Viscoelastic parameters providing the lowest e value are acquired as the output. At the final step, contact point position could be adjusted and the step 3 repeated to obtain the best fit. Details of the processing are given in the text. (b) Normalized relaxation modulus (E/E 0) for standard linear solid (SLS) and power-law rheology (PLR) relaxation models. Insets: schematic spring-dashpot representation and equation for the relaxation modulus. The SLS model is a spring in parallel with a spring-dashpot combination, leading to an exponential relaxation with a single relaxation time τ. The PLR model can be imagined as an infinite number of spring-dashpot combinations in parallel, leading to a continuous relaxation spectrum and power-law decay (α is the power law exponent).
