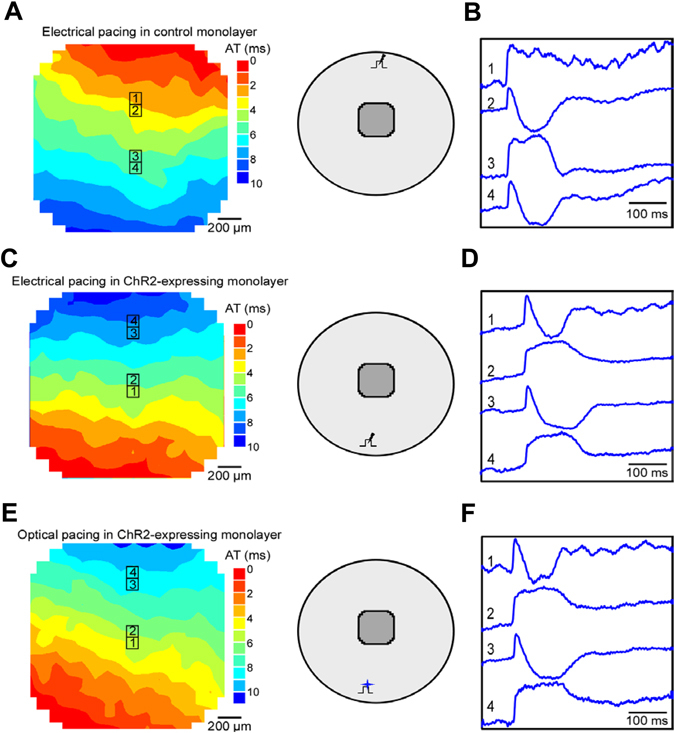
Figure 5.

Isochronal map of activation spread and selected Vm traces in NRVM monolayers. (A and B) A control monolayer during electrical pacing; (C and D) A ChR2-expressing monolayer during electrical pacing; (E and F): A ChR2-expressing monolayer during optical pacing. The schematic insets show the corresponding pacing site and mapping area. The black lightning symbol in the inset represents electrical pacing and the blue star symbol represents optical stimulation.
