
Figure 3.
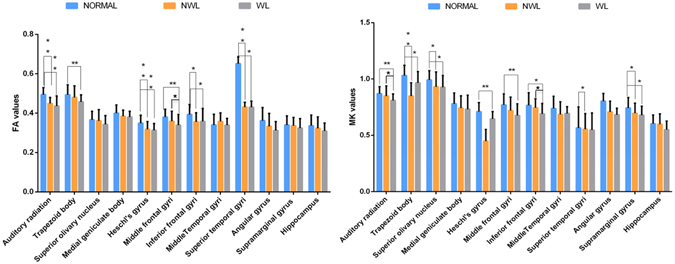
Significant differences in the FA (left) and MK (right) values in the various brain regions of controls and patients (NML or WL) above 3 years of age (*P < 0.05, **P < 0.01).
Official websites use .gov
A
.gov website belongs to an official
government organization in the United States.
Secure .gov websites use HTTPS
A lock (
) or https:// means you've safely
connected to the .gov website. Share sensitive
information only on official, secure websites.
Significant differences in the FA (left) and MK (right) values in the various brain regions of controls and patients (NML or WL) above 3 years of age (*P < 0.05, **P < 0.01).