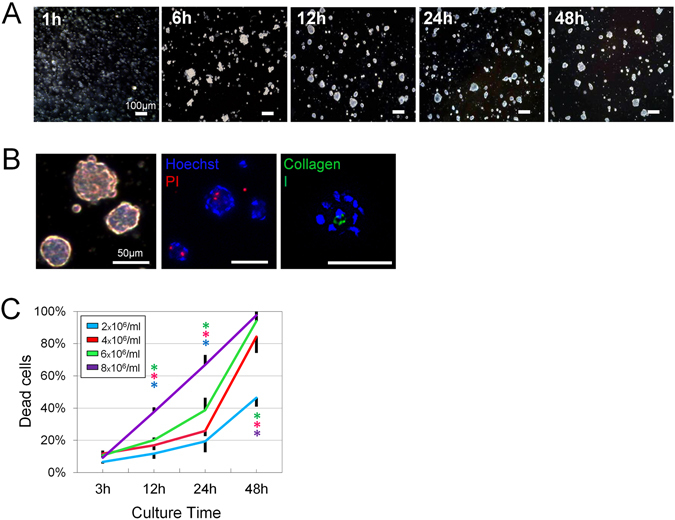
Figure 1.

Optimization of spheroid formation and cell viability. (A) Temporal change of human ASC spheroid formation during in-syringe culture. Scale bars = 200 µm. (B) Light-microscopic images of spheroids after 12 h culture (left). All nucleate cells were labeled with Hoechst (blue), while dead cells were labeled with PI (red; middle). Spheroids expressed Collagen type 1 (green) in their center (right). Scale bars = 50 µm. (C) Quantification of dead cells produced by different seeding densities at different time points during in-syringe culture (n = 3 random fields of 500 × 700 µm; 500–1000 cells/field; *F = 49.48; p < 0.0001).
