Figure 2.

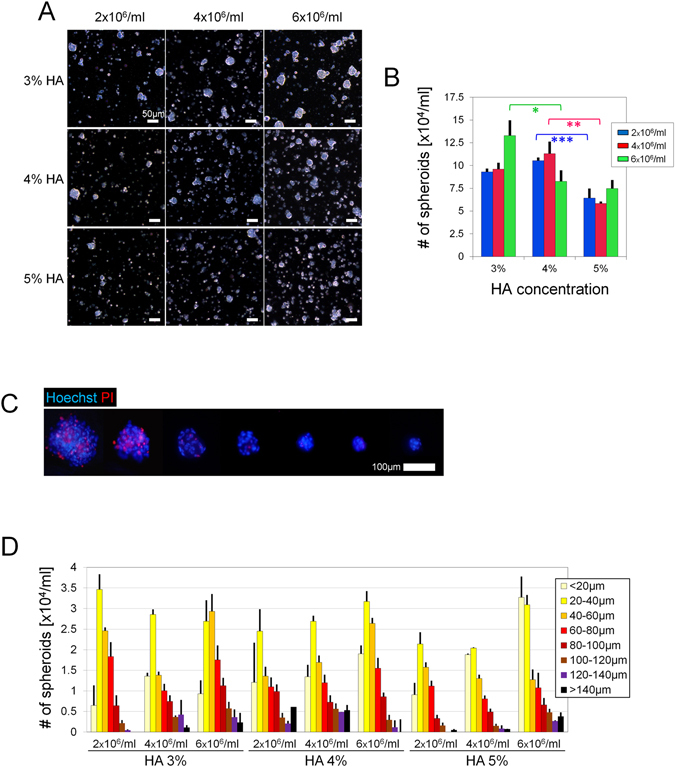
Optimization of spheroid preparation. (A) Representative microscopic images of spheroids after 12 h culture with different HA concentrations and seeding densities. Scale bars = 50 µm. (B) Total numbers of spheroids (>20 µm) yielded after 12 h culture. (C) Fluorescent microscopic images of spheroids of different sizes. Dead cells were labeled by PI (red) while nuclei were labeled with Hoechst (blue). Scale bars = 100 µm. (D) Size-distribution histogram of the products; n = 3 independent experiments; 50–200 particles of product analyzed in each sample; *p = 0.008, **p = 0.009, ***p = 0.034.
