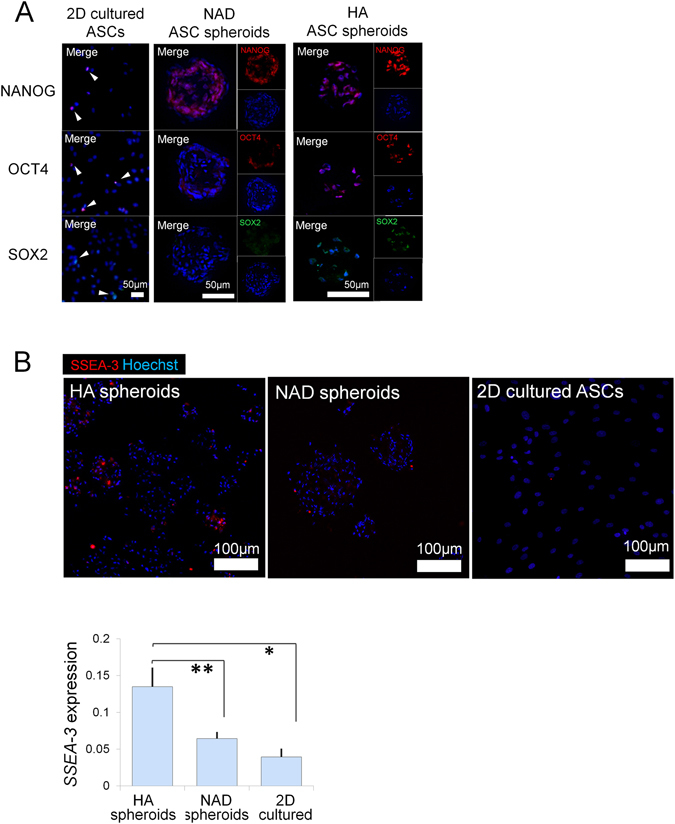
Figure 3.

Stem cell marker expression of spheroids. (A) Immunohistology for nuclear stem cell markers, NANOG, OCT4 and SOX2, in ASCs after 12 h culture on 2D petri dish, non-adhesive dish, and HA gel. Nuclei were labeled with Hoechst (blue). Scale bars = 50 µm. (B) SSEA-3 expression in ASCs 12 h after seeding on 2D petri dish (2D), non-adhesive dish (NAD), and in HA gel (HA). Bar graph showed the relative quantification of the SSEA-3 fluorescence. p = 0.019, *,**p < 0.05; n = 3 independent experiments. Scale bars = 100 µm.
