Figure 4.

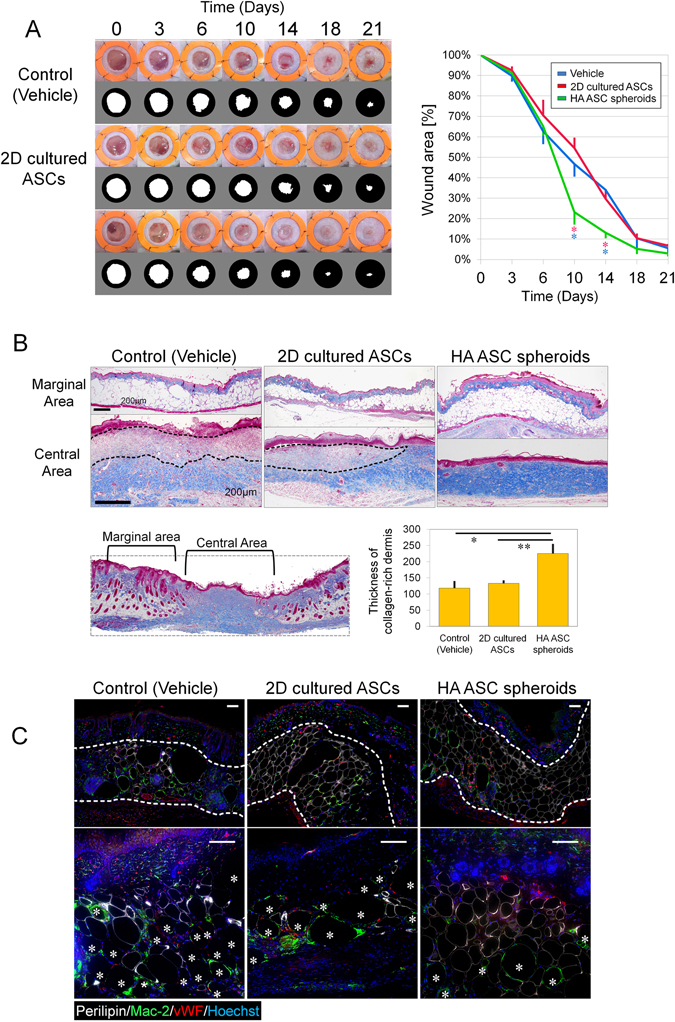
Wound healing of skin defects in diabetic mice. (A) Representative photos of wound healing in full-thickness cutaneous ulcers (left) and quantification of wound-opening sizes at different time points (right) in db/db mice. The inner diameter of the splints was 14 mm; n = 4 ulcers; *p day10 = 0.0245; *p day14 = 0.021. (B) Mallory-Azan trichrome stain of wound-tissue samples harvested 24 days post surgery (upper). Collagen was stained blue. Wound pathohistology was evaluated via quantification of dermal collagen deposition (lower). The dashed line indicates the collagen-poor area in the dermis; n = 4 ulcers; five points were photographically measured in each sample; *p = 0.040, **p = 0.043. Scale bars = 200 µm. (C) Immunofluorescence of the adipose layer of the wound: viable adipocytes (perilipin, white), macrophages (mac-2, green), vasculature (vWF, red), and nuclei (blue). *Represents crown-like structures which are perilipin-negative round area (oil drops) surrounded by Mac-2-positive infiltrated macrophages. Scale bars = 100 µm.
