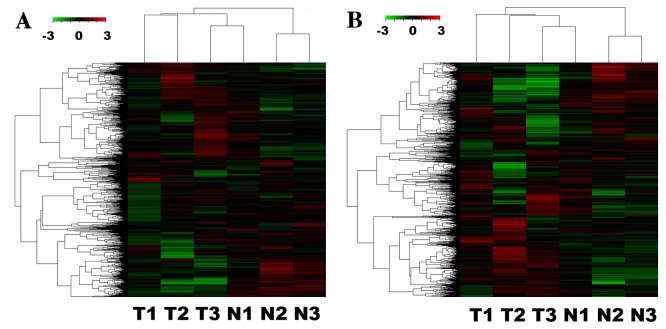
Figure 1.
Differences in the lncRNA and mRNA expression profiles between gallbladder carcinoma and non-tumorous tissues. (A) Results from hierarchical clustering demonstrate distinguishable (A) lncRNA and (B) mRNA expression profiling among samples. Red indicates increased relative expression and green indicates decreased relative expression. lncRNA, long non-coding RNA. T, tumor; N, wild-type.

