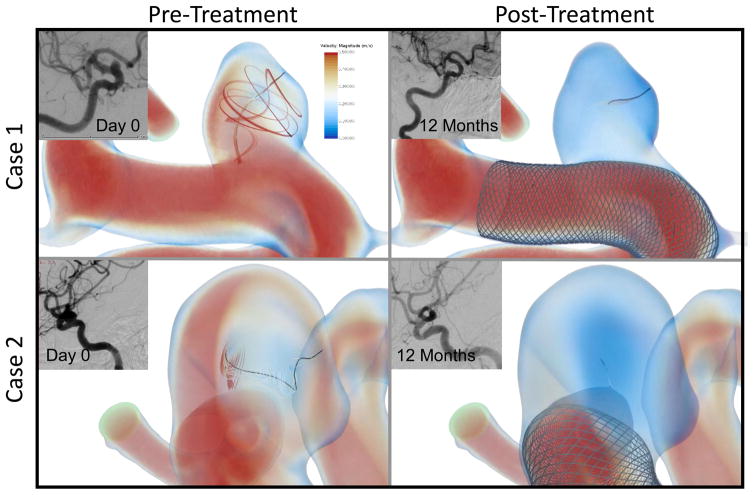
Figure 2.
Pre- and post-treatment velocity magnitude rendering and vortex corelines (black) with associated velocity streamlines for two representative aneurysms with successful outcome. Also shown is the angiographic image of the aneurysms before treatment and at 12-month follow-up showing complete obliteration of the aneurysm at follow-up. The complex vortex structures present in both the aneurysms in the pre-treatment CFD (left), which are diminished after implantation of the FD (right).

