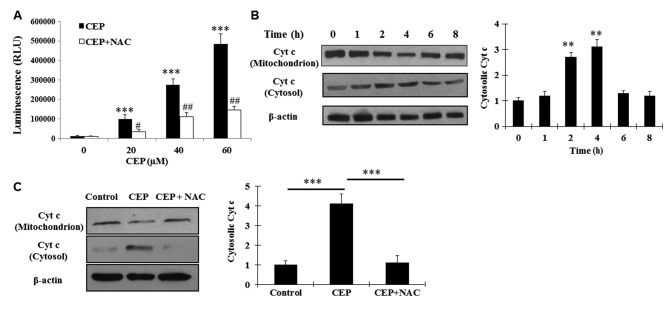
Figure 3.
CEP induces cellular ROS production and cyt c release from mitochondria. (A) Detection of ROS production of MEL15-1 cells treated with between 0 and 60 µM CEP in combination with or without 5 mM NAC for 24 h. Data represent the mean ± SD from three separate experiments. (B) Western blot analysis of cyt c from MEL15-1 cells treated with 40 µM CEP at various time points, and quantification of cyt c expression rate. (C) Western blot analysis of cyt c from MEL15-1 cells treated with 40 µM CEP with or without 5 mM NAC at 4 h, and quantification of cyt c expression rate. Protein expression rate in control groups was normalized to 1. β-Actin served as a loading control. Data are presented as the mean ± SD from three separate experiments. **P<0.01, ***P<0.001 vs. control; #P<0.05, ##P<0.01 vs. control. SD, standard deviation; cyt c, cyctochrome c; ROS, reactive oxygen species; CEP, cepharanthine; NAC, N-acetyl-L-cysteine; RLU, relative light units.

