
Figure 2.
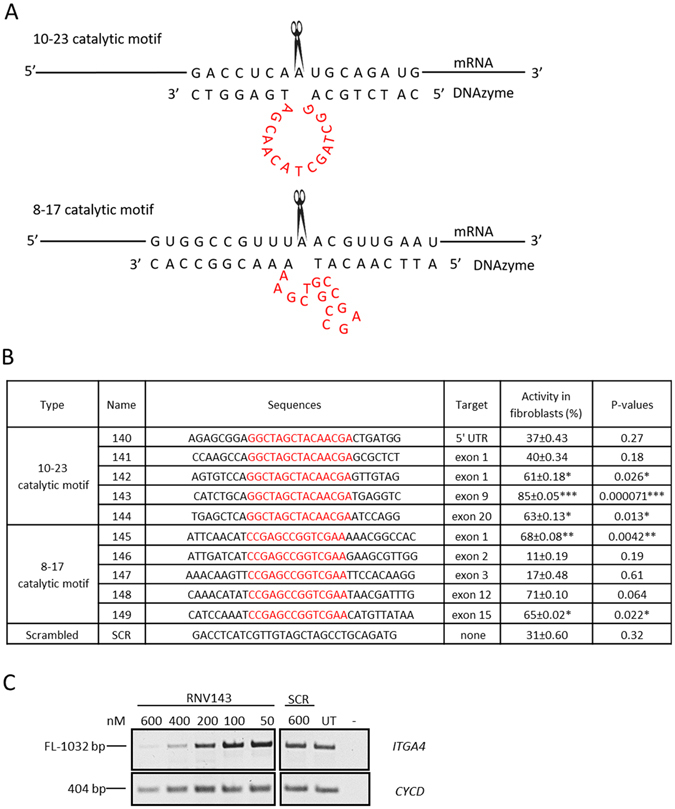
(A) Schematic illustration of the 10–23 and 8–17 catalytic motifs of DNAzymes. (B) Table for the activities of first-generation DNAzymes targeting ITGA4 mRNA that is directly correlated with the percentages of ITGA4 mRNA knockdown (See Materials and Methods for detailed procedures); The catalytic motifs are shown in red, the arm regions are in black, and the sequences are from 5′ → 3′. p-values were calculated for the activity in fibroblasts which was normalised to the UT using student t-test and *Indicates p-value < 0.05, **Indicates p-value < 0.005 and ***Indicates p-value < 0.0005. p-values have been rounded to 2 s.f. (C) Representative RT-PCR products of the ITGA4 and CycD transcripts from normal human primary fibroblasts after treatment with DNAzyme at different concentrations. The RT-PCR products after treatment with RNV143 are shown here. FL, full-length; UT, untreated; SCR, scrambled sequence; CYCD was used as a loading control. The gel images were cropped to highlight the ITGA4 specific products and the corresponding house-keeping gene control CYCD. The original images are shown in Figure S2 (Supplementary Information).