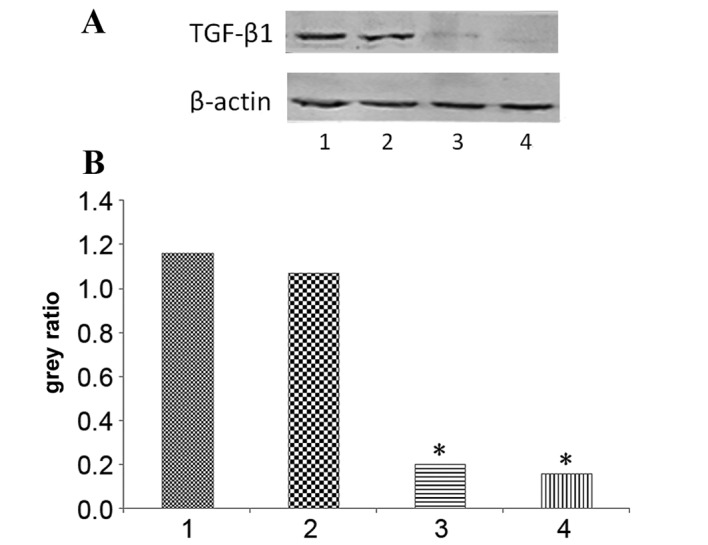
Figure 1.

TGF-β1 protein expression levels decreased following TGF-β1 siRNA knockdown in HepG2 cells. (A) Representative protein bands from the western blotting. (B) Protein band quantification. 1, control group; 2, negative siRNA control group; 3, 72 h TGF-β1 siRNA transfection group; 4, 96 h TGF-β1 siRNA transfection group. Values were normalized to β-actin and expressed as the mean ± standard deviation of triplicate data. *P<0.05, vs. the control group. TGF-β1, transforming growth factor-β-1; siRNA, small interfering RNA.
