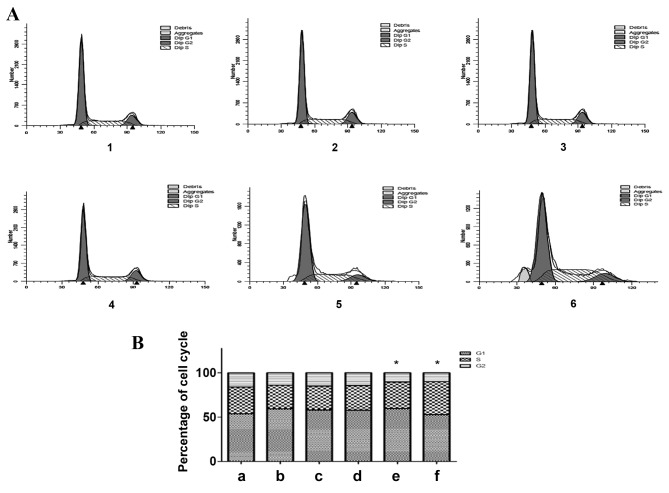
Figure 4.
Effect of altered TGF-β1 expression on the HepG2 cell cycle distribution. (A) Flow cytometric analysis of HepG2 cell cycle distribution and (B) quantification of the flow cytometric data. 1, control group; 2, 24 h exogenous TGF-β1 group; 3, 48 h exogenous TGF-β1 group; 4, 72 h exogenous TGF-β1 group; 5, 72 h TGF-β1-knockdown group; 6, 96 h TGF-β1-knockdown group. *P<0.05, vs. the control group. TGF-β1, transforming growth factor-β-1.

