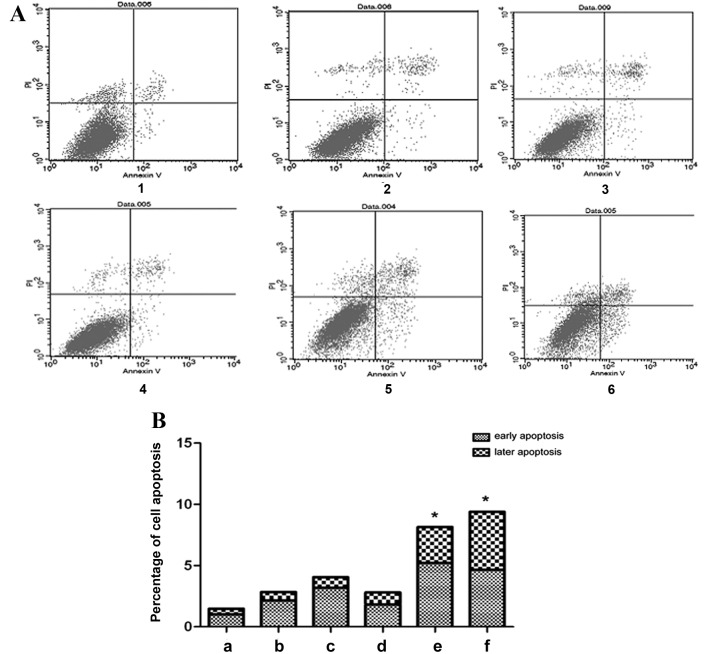
Figure 5.
Effect of altered TGF-β1 on HepG2 cell apoptosis. (A) Flow cytometric analysis of HepG2 cell apoptosis and (B) quantification of the flow cytometric data. 1, control group; 2, 24 h exogenous TGF-β1 group; 3, 48 h exogenous TGF-β1 group; 4, 72 h exogenous TGF-β1 group; 5, 72 h TGF-β1-knockdown group; 6, 96 h TGF-β1-knockdown group. In the scatter diagram, the upper left quadrant represents mechanically damaged cells, the upper right quadrant represents late apoptotic cells, the lower left quadrant represents normal cells and the lower right quadrant represents early apoptotic cells. *P<0.05, vs. the control group. TGF-β1, transforming growth factor-β-1; PI, propidium iodide.

