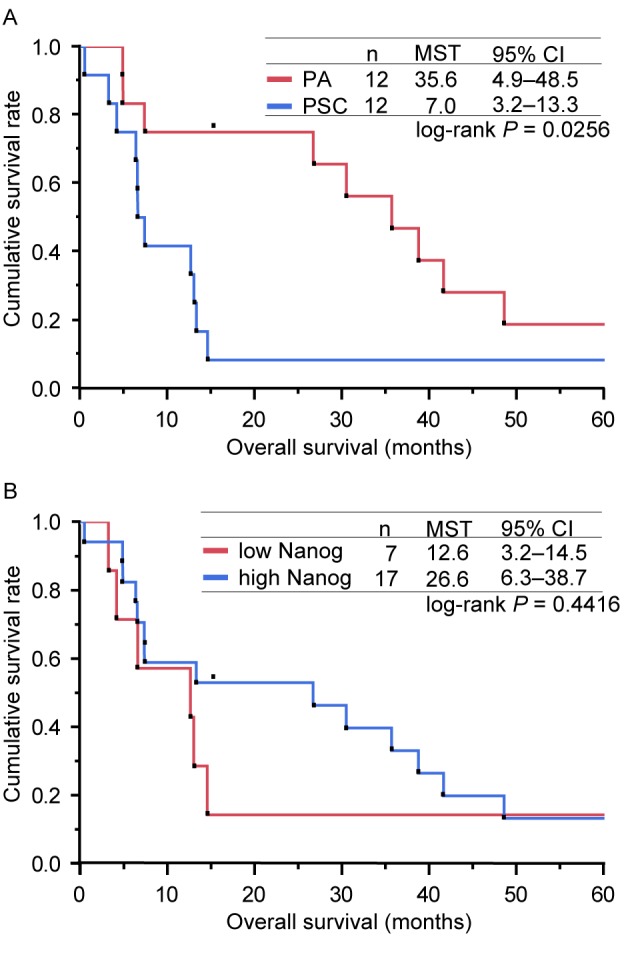
Figure 3.

Kaplan-Meier curves for the overall survival of patients in the present study. (A) Kaplan-Meier curves for the OS of patients according to the type of lung cancer (PA or PSC). The MSTs determined for the patients with PSC and PA were 7.0 and 35.6 months, respectively (log-rank test, P=0.0256). (B) Kaplan-Meier curves for OS of patients, presented according to the expression level of NANOG (low or high). The MSTs calculated for the patients who expressed NANOG at low and high levels were 12.6 and 26.6 months, respectively (log-rank test, P=0.4416). OS, overall survival; PSC, pulmonary sarcomatoid carcinoma; PA, pulmonary adenocarcinoma; MSTs, median survival times; CI, confidence interval; NANOG, homeobox protein NANOG.
