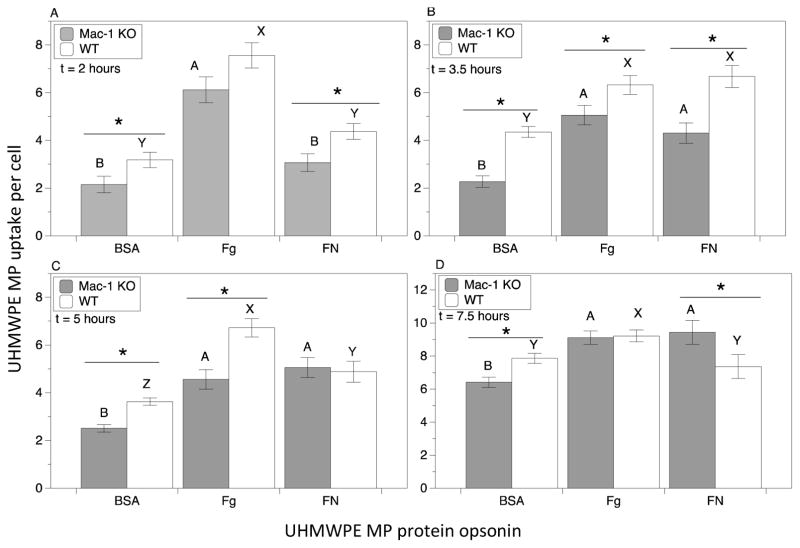
Figure 4.
Integrin Mac-1 modulates macrophage uptake of fluorescently labeled protein-opsonized UHMWPE microparticles (MPs). Microparticles pre-coated with opsonizing protein were incubated with macrophages at a 40:1 ratio of MP:cell, and uptake was quantified at: A.) 2 h B.) 3.5 h C.) 5 h, and D.) 7.5 h. Results comparing Mac-1 KO macrophages to WT controls as well comparing particle uptake across different opsonizing protein coatings within the same group (Mac-1 KO or WT) are shown. The average number of MPs per cell taken up was quantified by pooling data from at least 24 samples from 4 separate runs. Plotted are mean and standard error. Pair-wise significant differences using t-test between Mac-1 KO and WT control samples for each protein coating is denoted by the * symbol (p value < 0.05). Uppercase letters denote significant differences (p < 0.05) among all groups analyzed by ANOVA and Tukey’s post hoc test, where groups labeled with a differing capital letters are significantly different from each other, and groups with identical capital letters are not.

