
Figure 1.
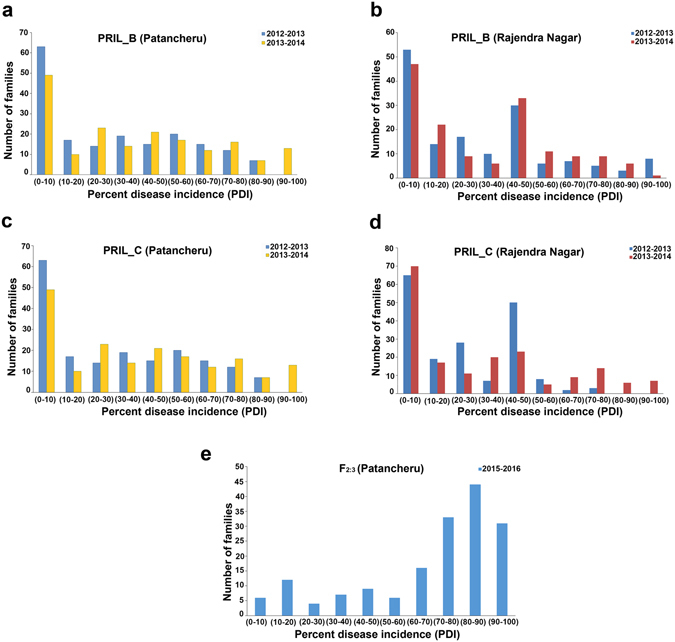
Frequency distribution of percent disease incidence (PDI) for Patancheru SMD isolate in various populations at different locations and years. The disease scoring was done on the basis of percentage of affected plants wherein 0% means complete resistance while 100% means complete susceptibility to SMD. The PDI was monitored for two consecutive years (2012–2013, 2013–2014) in ICPL 20096 × ICPL 332 (PRIL_B) and ICPL 20097 × ICP 8863 (PRIL_C) population while for one year (2015–2016) in ICP 8863 × ICPL 87119 (F2) population. The PDI was divided into 10 categories and number of families falling in each category were plotted as bar plot. The PDI in ICPL 20096 × ICPL 332 (PRIL_B) population at Patancheru location and Rajendranagar, Hyderabad location is shown in a and b. Figure c and d represent PDI in ICPL 20097 × ICP 8863 (PRIL_C) population at Patancheru and Rajendranagar, Hyderabad location respectively, while, the Figure e represents the PDI in ICP 8863 × ICPL 87119 (F2) population at Patancheru location.