
Figure 2.
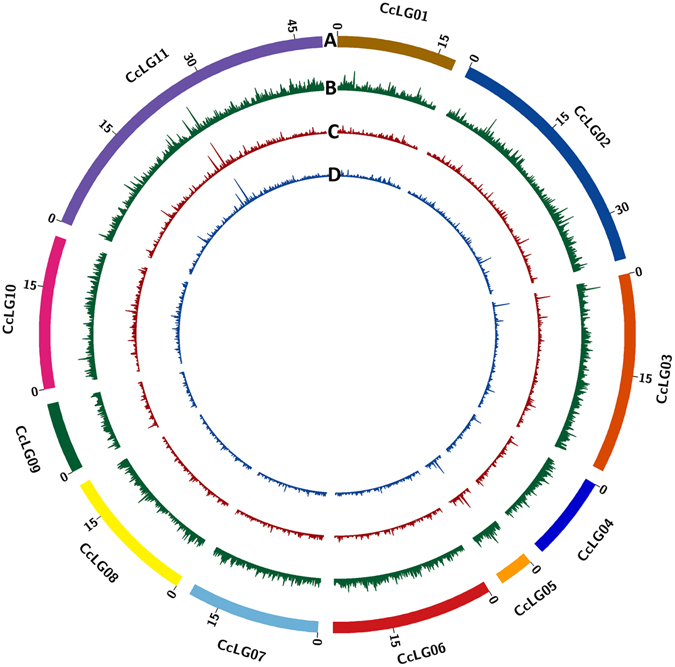
Genome-wide distribution of SNPs identified in ICPL 20096 × ICPL 332 (PRIL_B), ICPL 20097 × ICP 8863 (PRIL_C) and ICP 8863 × ICPL 87119 (F2) populations in pigeonpea. The number of SNPs identified within 100 Kb interval were calculated and plotted as a smooth line curve. The height of the curve is proportional to the number of SNPs within that 100 Kb interval. (A) Pigeonpea pseudomolecules, labelled as CcLG01 to CcLG11 and each pseudomolecule is shown in different colour. The numbers on arches represent the scale for the size of pseudomolecule in Mb. (B) Genome-wide distribution of SNPs identified in ICPL 20096 × ICPL 332 (PRIL_B) population (C) Genome-wide distribution of SNPs identified in ICPL 20097 × ICP 8863 (PRIL_C) population and (D) Genome-wide distribution of SNPs identified in ICP 8863 × ICPL 87119 (F2) population in pigeonpea.