
Figure 3.
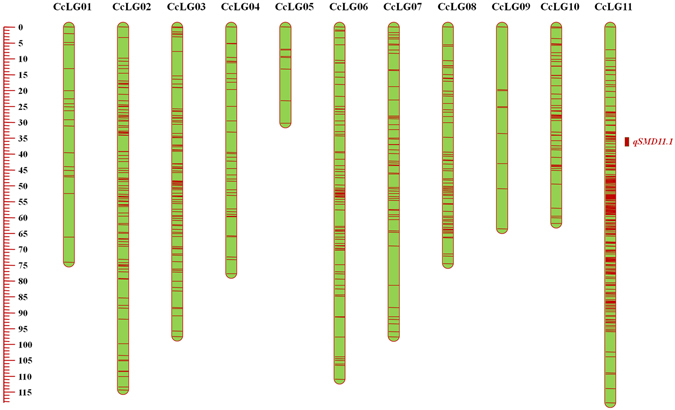
Genetic and QTL map comprising 1,101 SNPs and spanning 921.21 cM in ICPL 20096 × ICPL 332 (PRIL_B) population in pigeonpea. The scale on left side represents map distance in cM. The eleven linkage groups are shown as vertical bars and each horizontal line on the bar represent single SNP marker. Aggregation on horizontal lines indicate higher marker density on that particular linkage group. The single, consistent QTL (qSMD11.1) identified for SMD resistance on CcLG11 is shown by coloured rectangle.