
Figure 4.
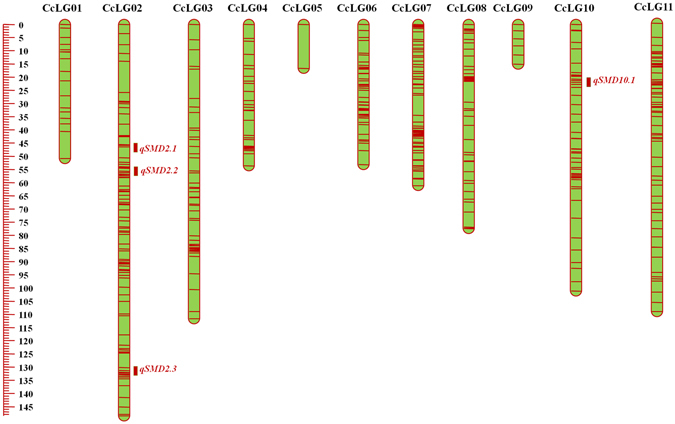
Genetic and QTL map constructed using 484 SNPs and of 798.25 cM length in ICPL 20097 × ICP 8863 (PRIL_C) population in pigeonpea. The scale on left side represents map distance in cM. The eleven linkage groups are shown as vertical bars and each horizontal line on the bar represent single SNP marker. Aggregation on horizontal lines indicate higher marker density on that particular linkage group. Three and one rectangles on right side of CcLG02 and CcLG10 represent the four QTLs identified for SMD resistance in PRIL_C population.