Figure 5.

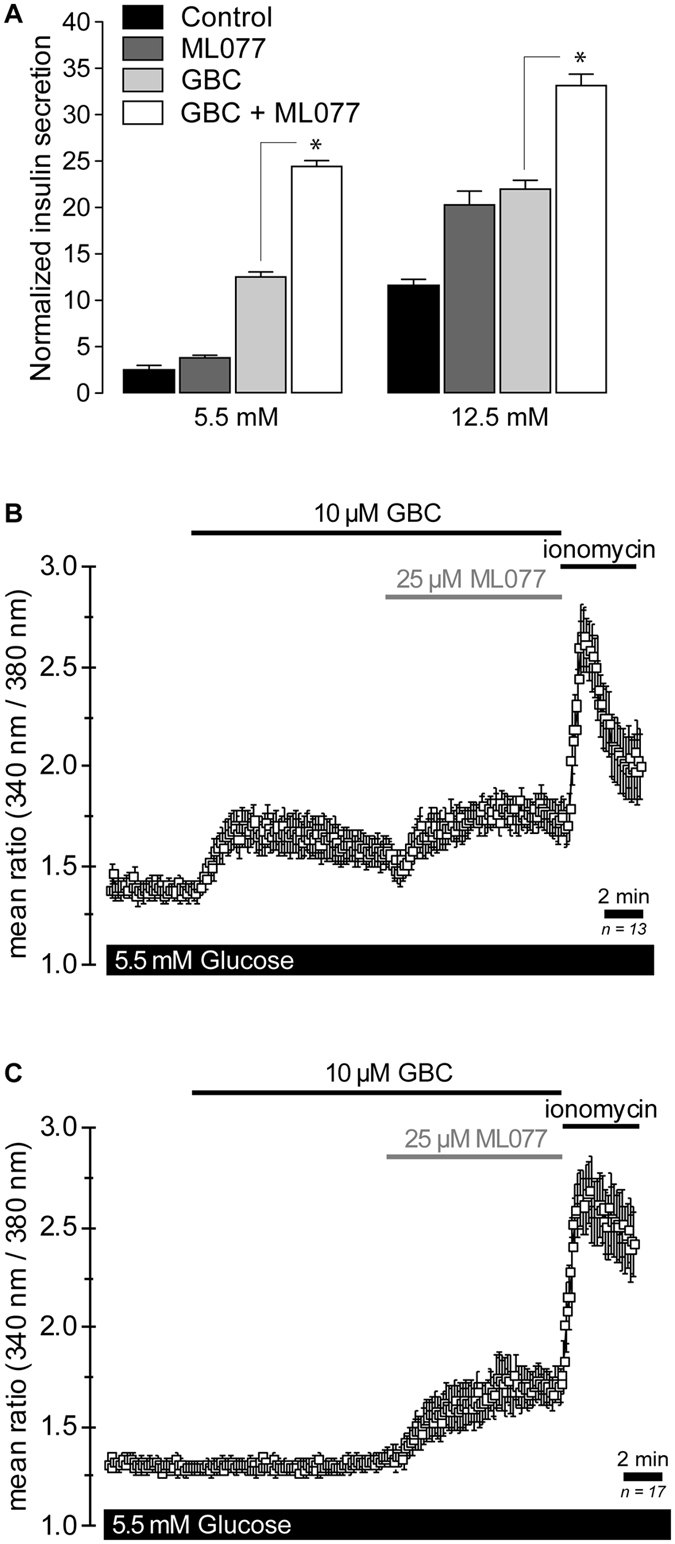
ML077 increases insulin secretion and glibenclamide-induced Ca2+ elevation in MIN6 β-cells. (A) Insulin secretion in MIN6 β-cells under low and high glucose conditions either in the presence of ML077 (25 µM, dark gray bars), glibenclamide (GBC 10 µM, light gray bars) or both (empty bars). Results are expressed as percentage of total insulin content (n = 3, *p < 0.05). (B) Single-cell Ca2+ imaging in Fura2-loaded MIN6 β-cells (n = 13) under basal secretory conditions (5.5 mM glucose). Addition of 10 µM GBC evoked a rapid cytosolic Ca2+ elevation, which was increased by 25 µM ML077. (C) Experiment identical to A in a group of cells that did not exhibit Ca2+ elevation in response to 10 µM GBC. Addition of 25 µM ML077 in the presence of 10 µM GBC evoked Ca2+ increases. In B and C, ionomycin (10 µM) was applied at the end of the experiment to estimate maximum Ca2+ responses. Each symbol represents a mean 340 nm/380 nm fluorescence ratio from 13 and 17 cells (B and C) ± SEM.
