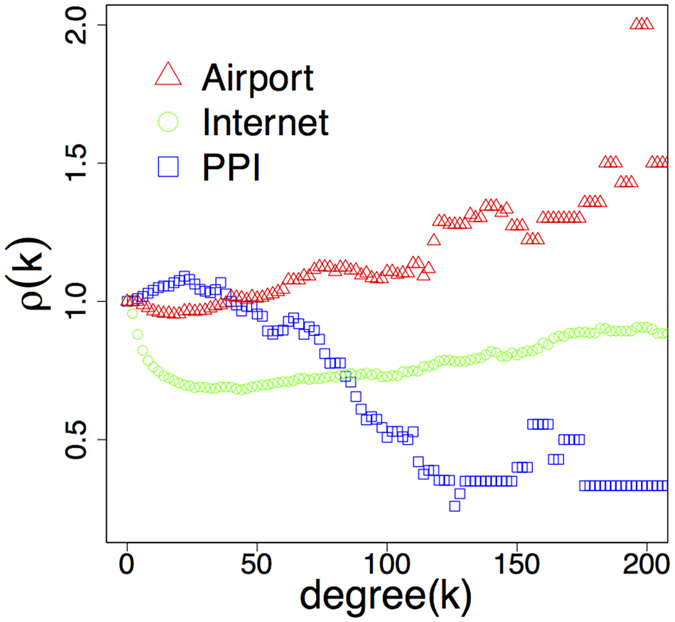
Figure 1.

Illustration of the diverse rich club organization in real networks. The plot shows the normalized rich club coefficient ρ(k) as the function of degree k as: is the density of the subgraph G k of the network containing only the nodes with degree > k. The ϕ unc is the same for the maximally randomized version of the network conserving the degree distribution. One can see that the subgraph of hubs in the airport network possesses about 1.5 times more links than in the randomized version. On the contrary, the hubs in the PPI network have less than the half of the connections experienced in its randomized counterpart.
