Figure 1.

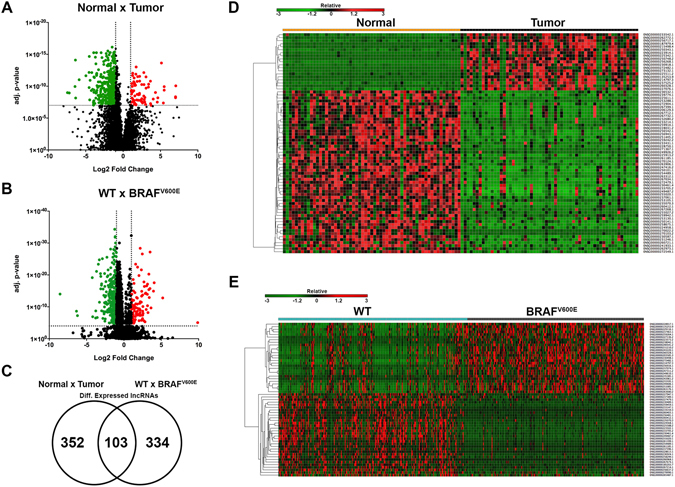
Differentially expressed lncRNAs between N × T and WT × BRAFV600E were identified. (A) Volcano plot of DE lncRNAs between N × T (log2 fold change > 1 or < −1; adj. p-value < 1 × 10⁻⁷). (B) Volcano plot of DE lncRNAs between WT × BRAFV600E (log2 fold change > 1 or < −1; adj. p-value < 1 × 10⁻⁴). (C) Venn Diagram of common DE lncRNAs between N × T and WT × BRAFV600E. (D) Heatmap* of DE lncRNAs between N × T (log2 fold change > 3 or < −3; adj. p-value < 1 × 10⁻⁷). (E) Heatmap* of DE lncRNAs between WT × BRAFV600E (log2 fold change > 2.5 or < −2.5; adj. p-value < 1 × 10⁻⁴). *For hierarchical clustering, one minus Spearman rank correlation was performed.
