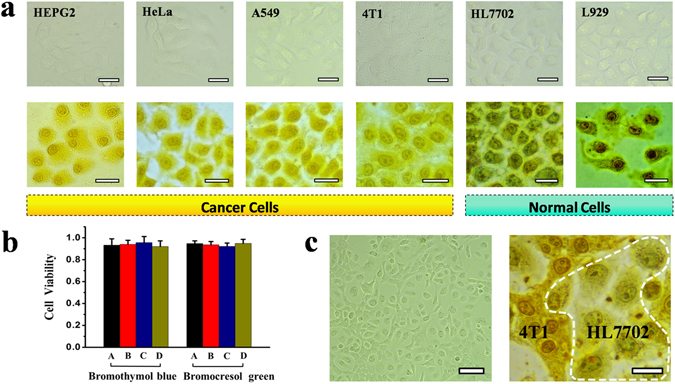
Figure 2.

Visual identification and screening of cancer cells from normal cells and cytotoxicity assays. (a) Bright-field optical microscope images of cancerous HepG2, HeLa, A549, 4T1, normal HL7702 and L929 cells before and after 5 min incubation with 1 mg mL−1 of bromothymol blue, respectively; All scale bars: 20 μm. (b) Cytotoxicity assays for the A549, HeLa, HL7702, and L929 cells after the incubation with bromothymol blue or bromocresol green. A, B, C, D under the X-coordinate represent A549, HeLa, HL7702, and L929 cells, respectively. (c) Bright-field microscopy images of cocultured cancerous 4T1 and normal HL7702 cells before (left, scale bar: 50 μm) and after (right, scale bar: 15 μm) the treatment with bromocresol green. The cells within the white dotted line are identified as HL7702 cell.
